 19
19peptides
spectra
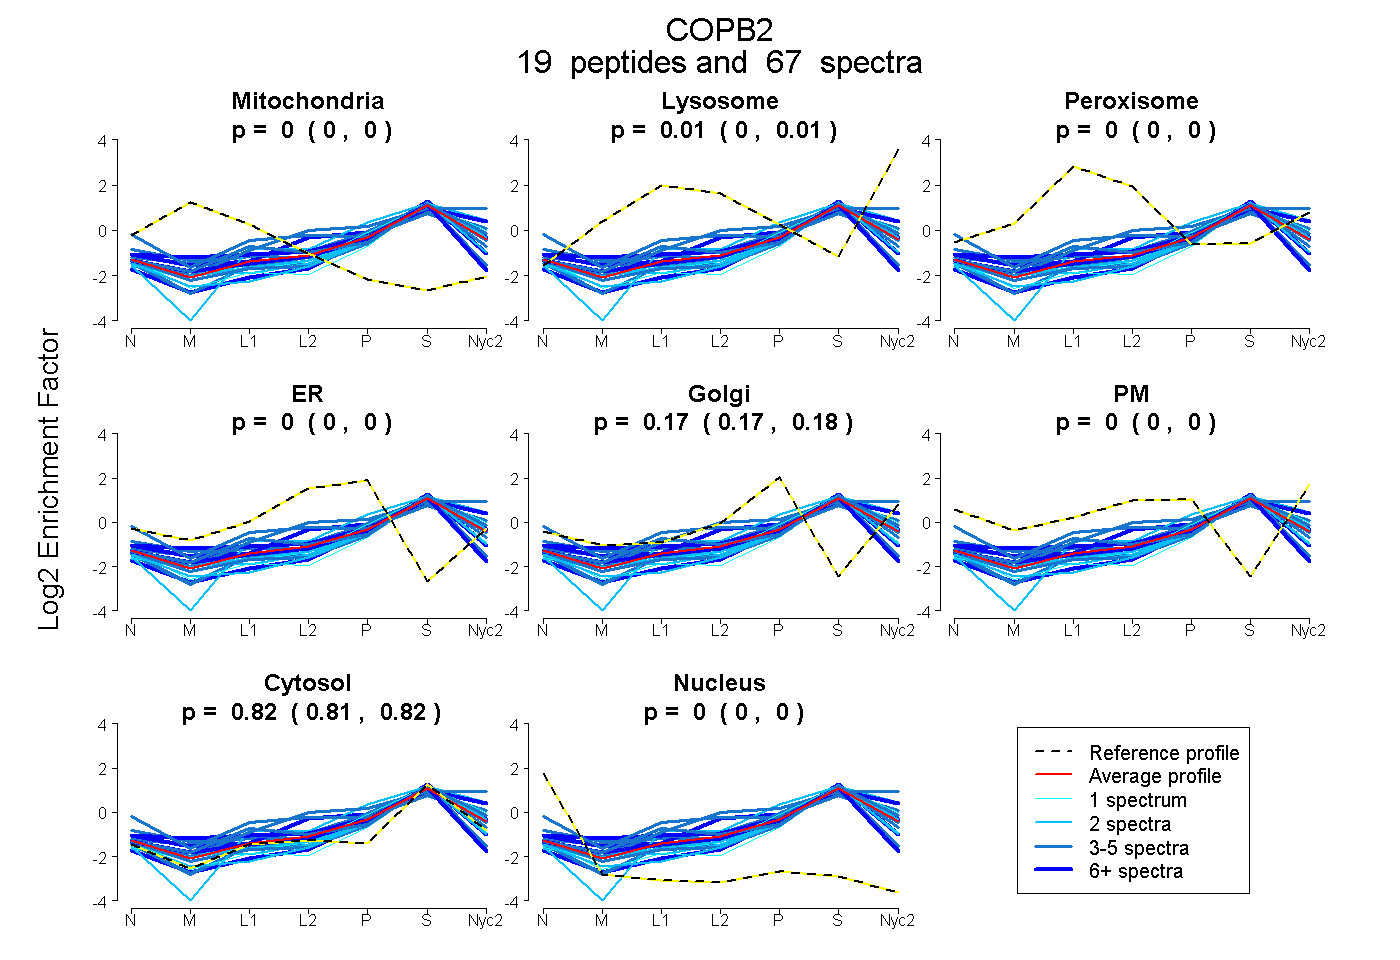
0.000 | 0.000
0.003 | 0.014
0.000 | 0.000
0.000 | 0.000
0.170 | 0.178
0.000 | 0.000
0.813 | 0.820
0.000 | 0.000
10peptides
spectra
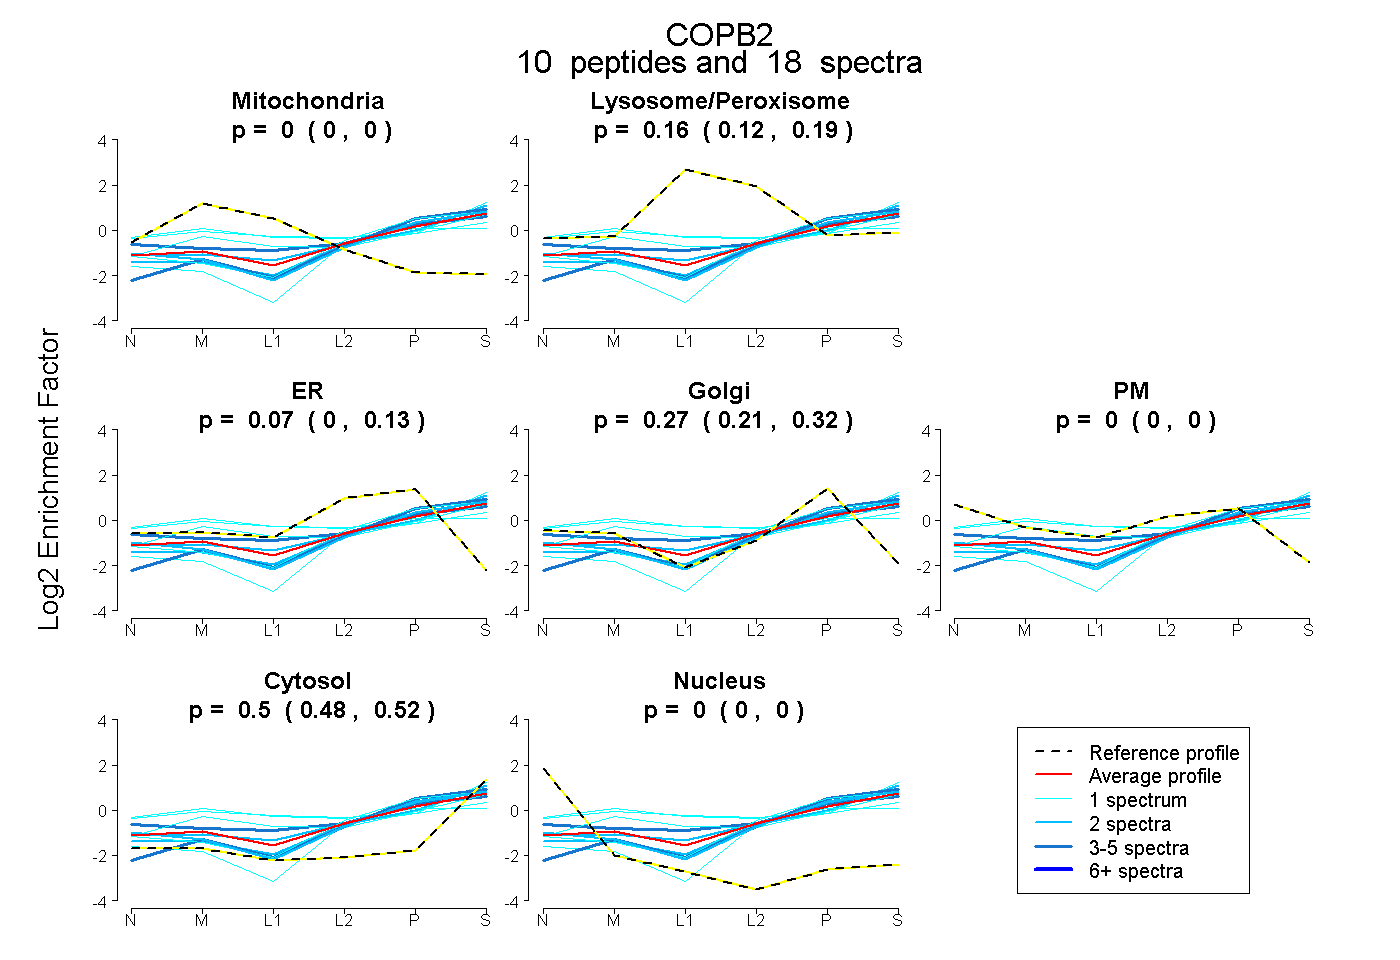
0.000 | 0.000
0.123 | 0.193
0.000 | 0.131
0.208 | 0.316
0.000 | 0.000
0.481 | 0.522
0.000 | 0.000
17peptides
spectra
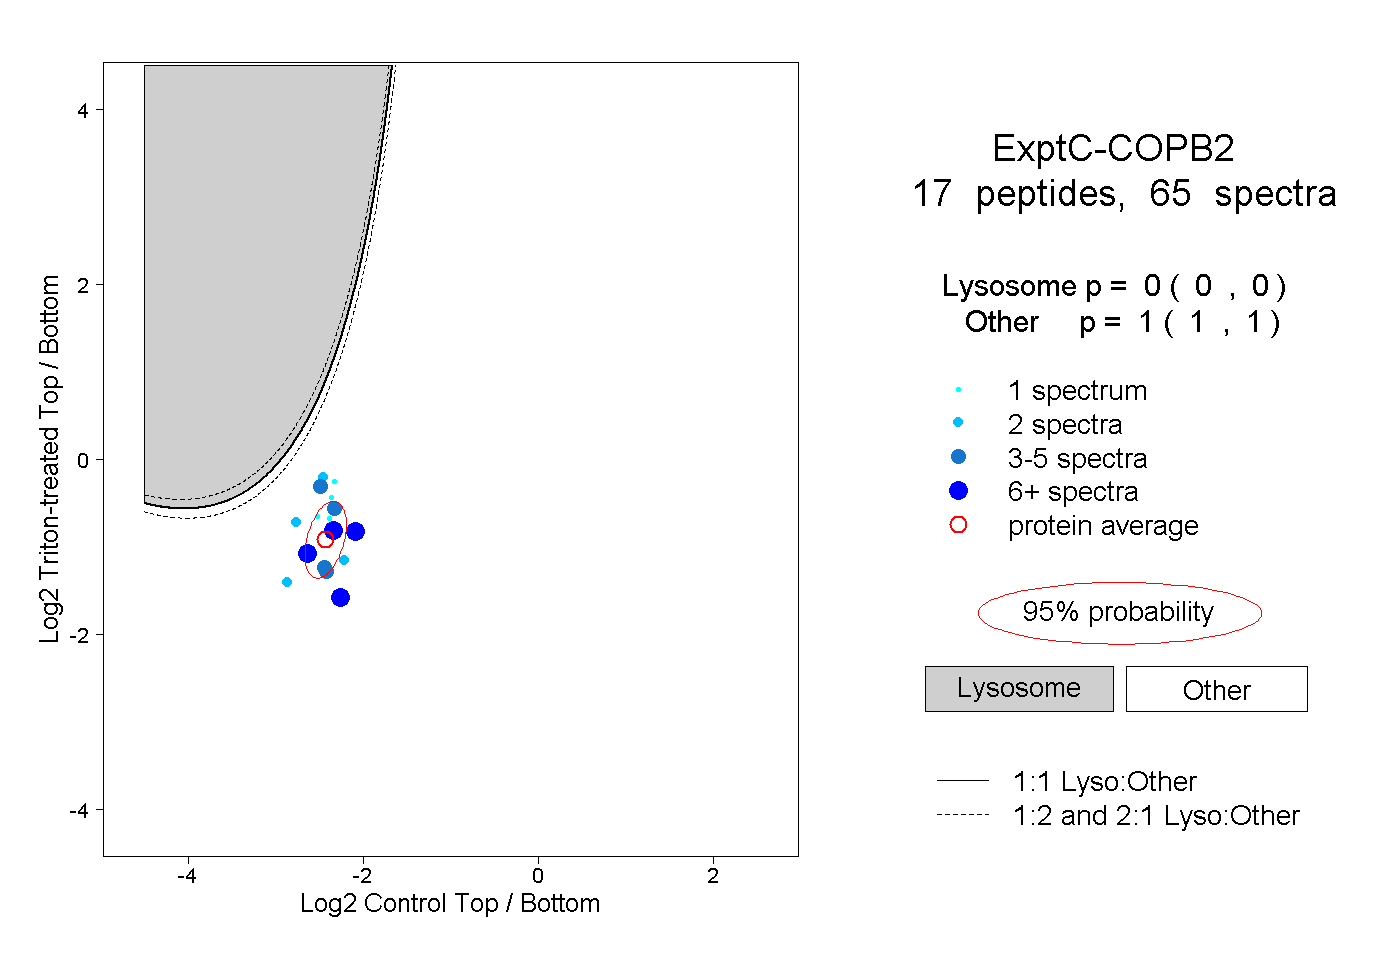
0.000 | 0.000
1.000 | 1.000
1peptide
spectrum
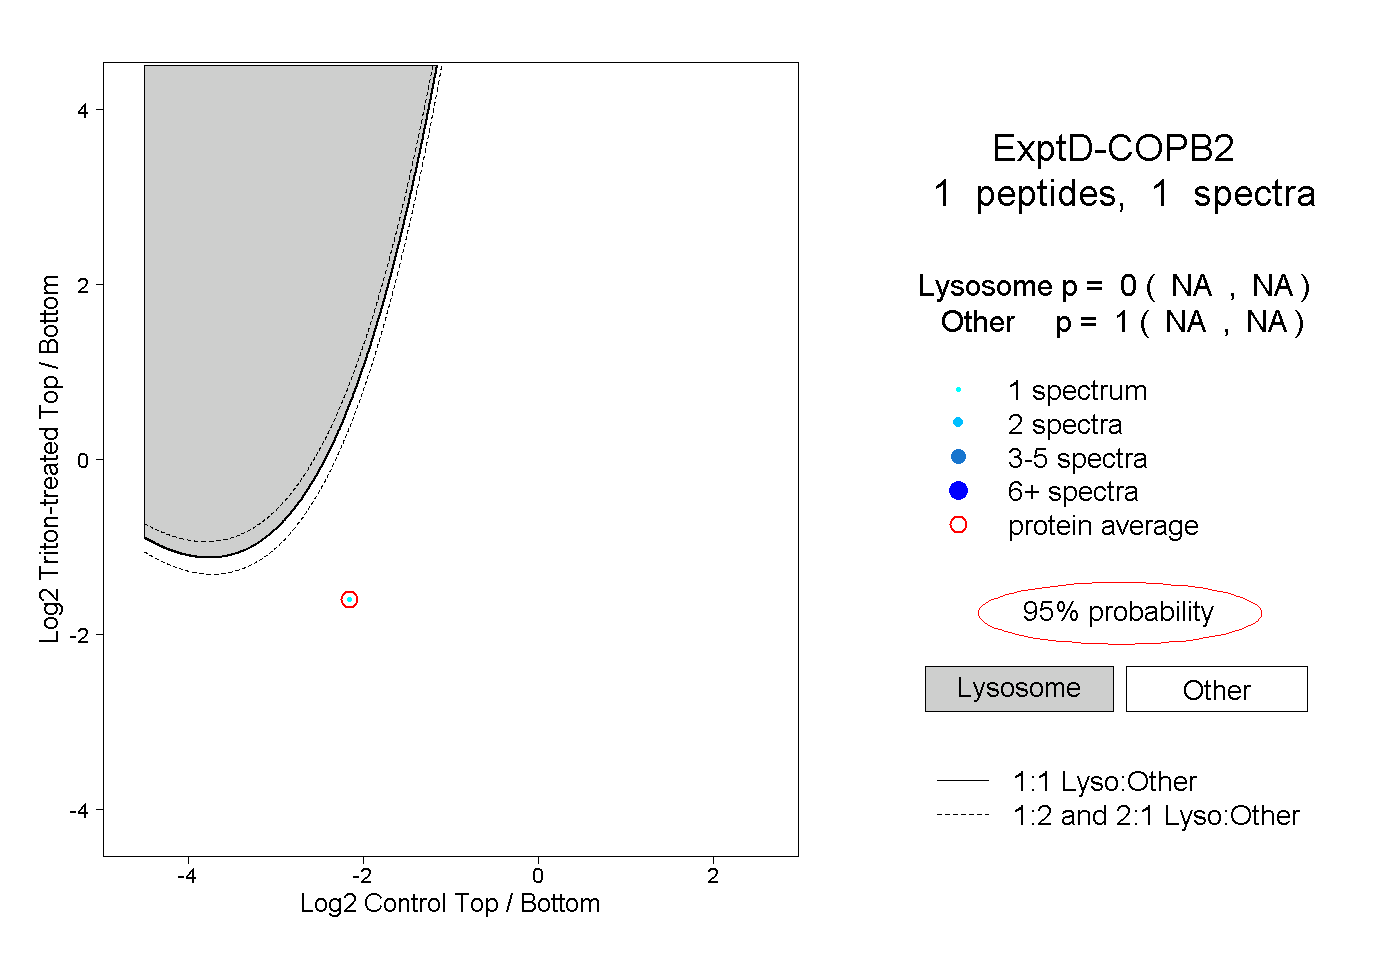
NA | NA
NA | NA