 20
20peptides
spectra
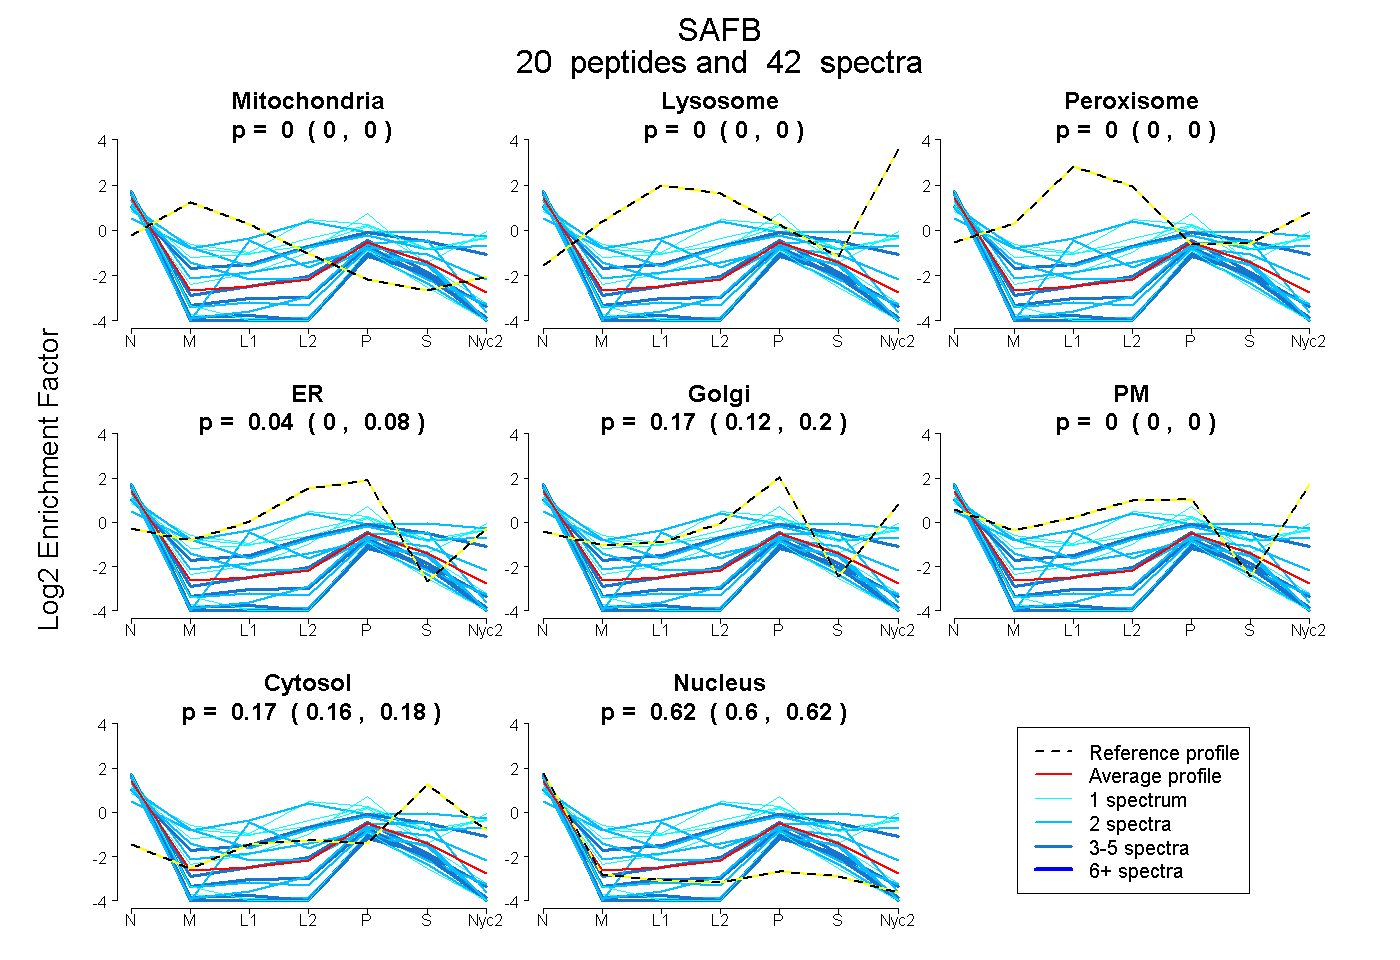
0.000 | 0.000
0.000 | 0.000
0.000 | 0.000
0.000 | 0.084
0.118 | 0.202
0.000 | 0.000
0.165 | 0.183
0.604 | 0.624
2peptides
spectra
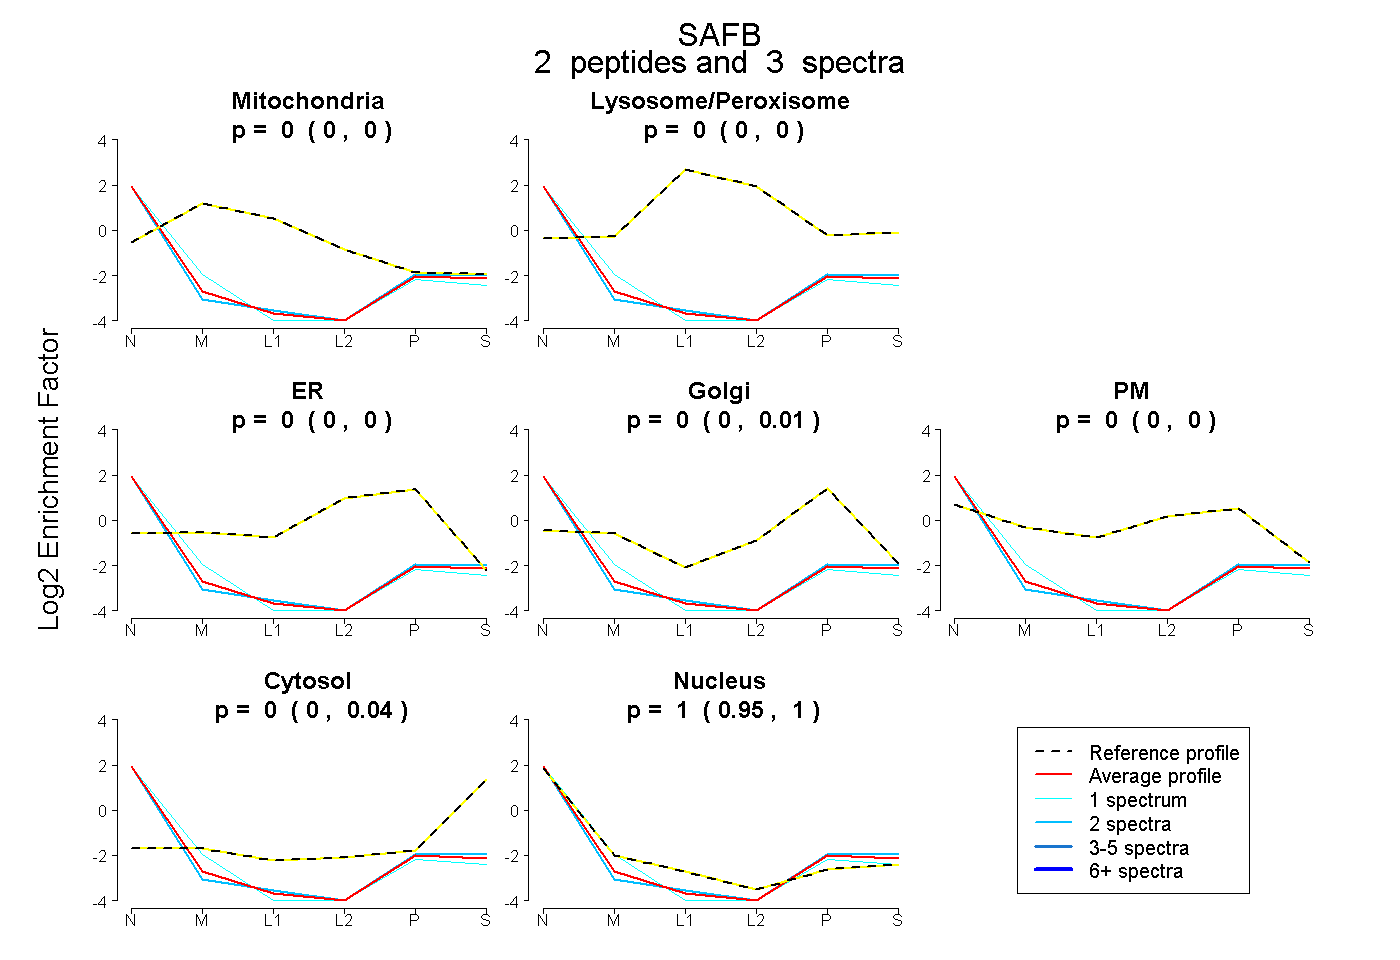
0.000 | 0.000
0.000 | 0.000
0.000 | 0.000
0.000 | 0.008
0.000 | 0.000
0.000 | 0.036
0.953 | 1.000
2peptides
spectra
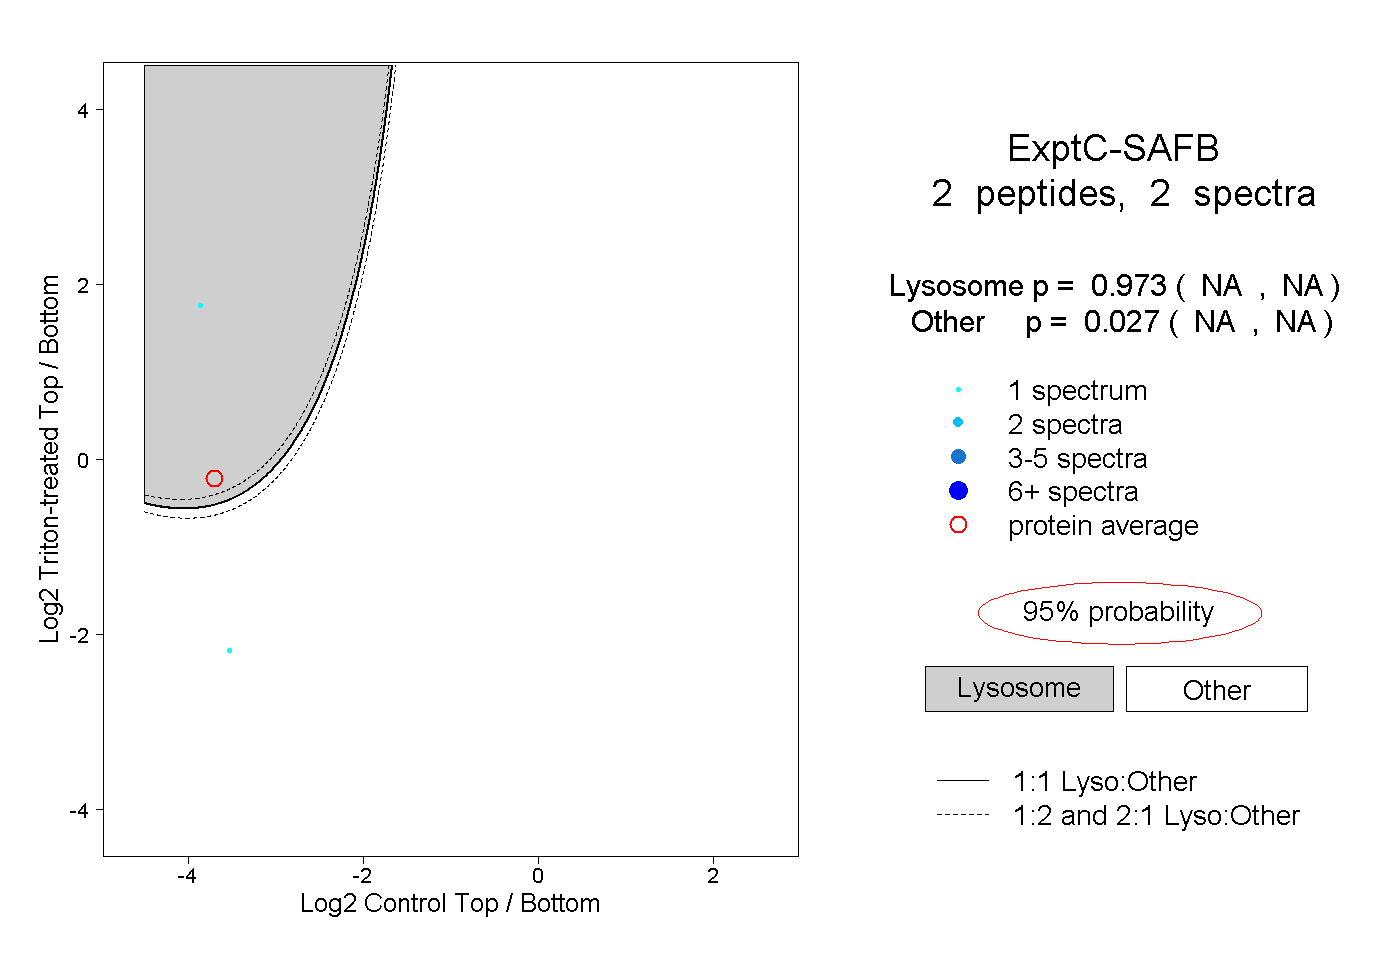
NA | NA
NA | NA