 59
59peptides
spectra
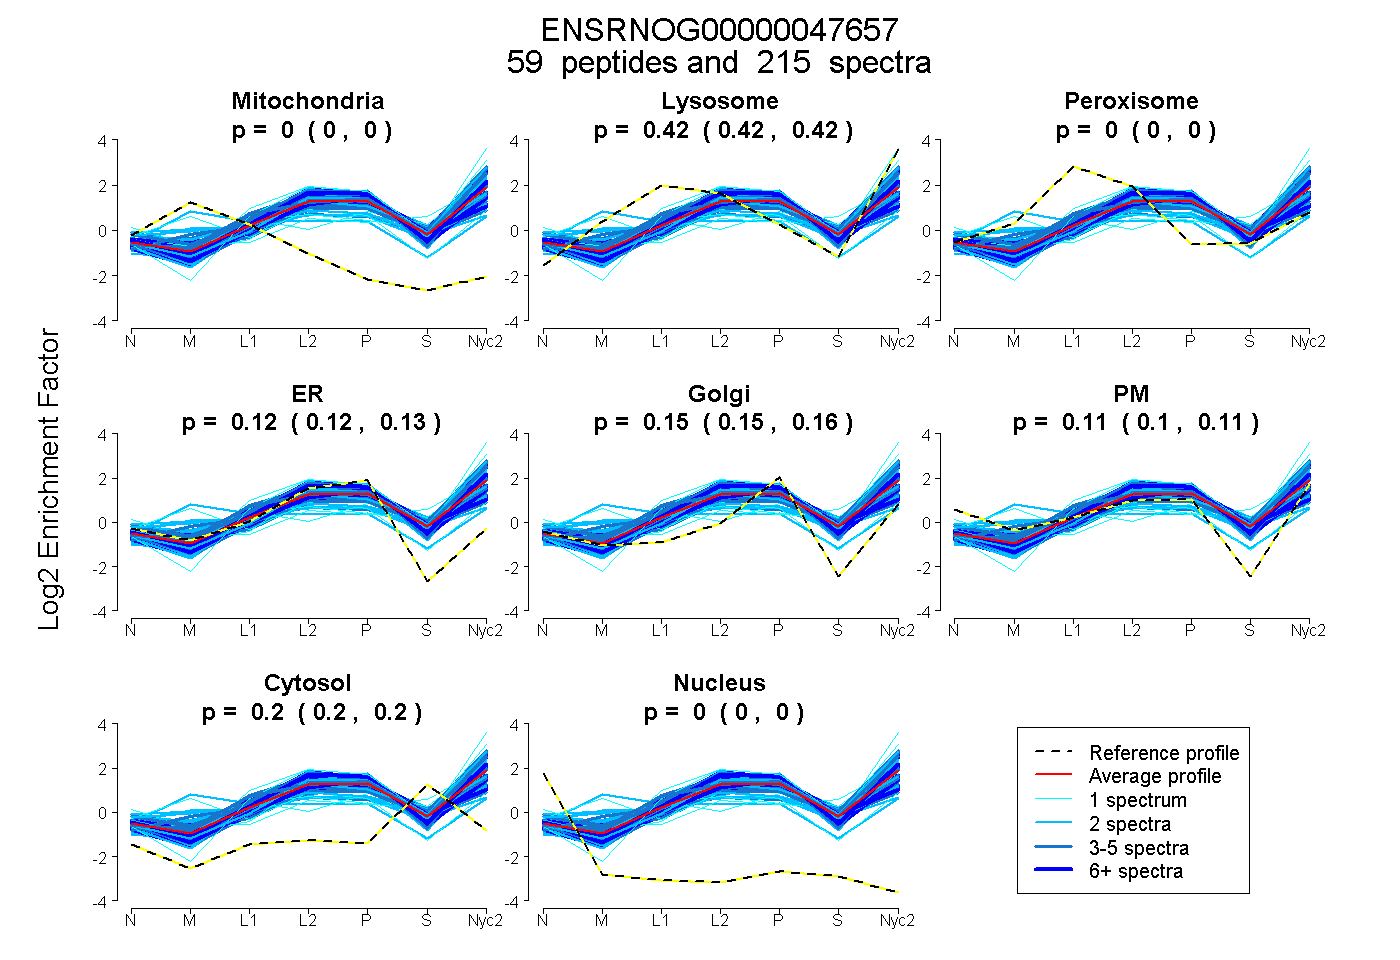
0.000 | 0.000
0.419 | 0.422
0.000 | 0.000
0.118 | 0.126
0.150 | 0.157
0.104 | 0.109
0.196 | 0.198
0.000 | 0.000
30peptides
spectra
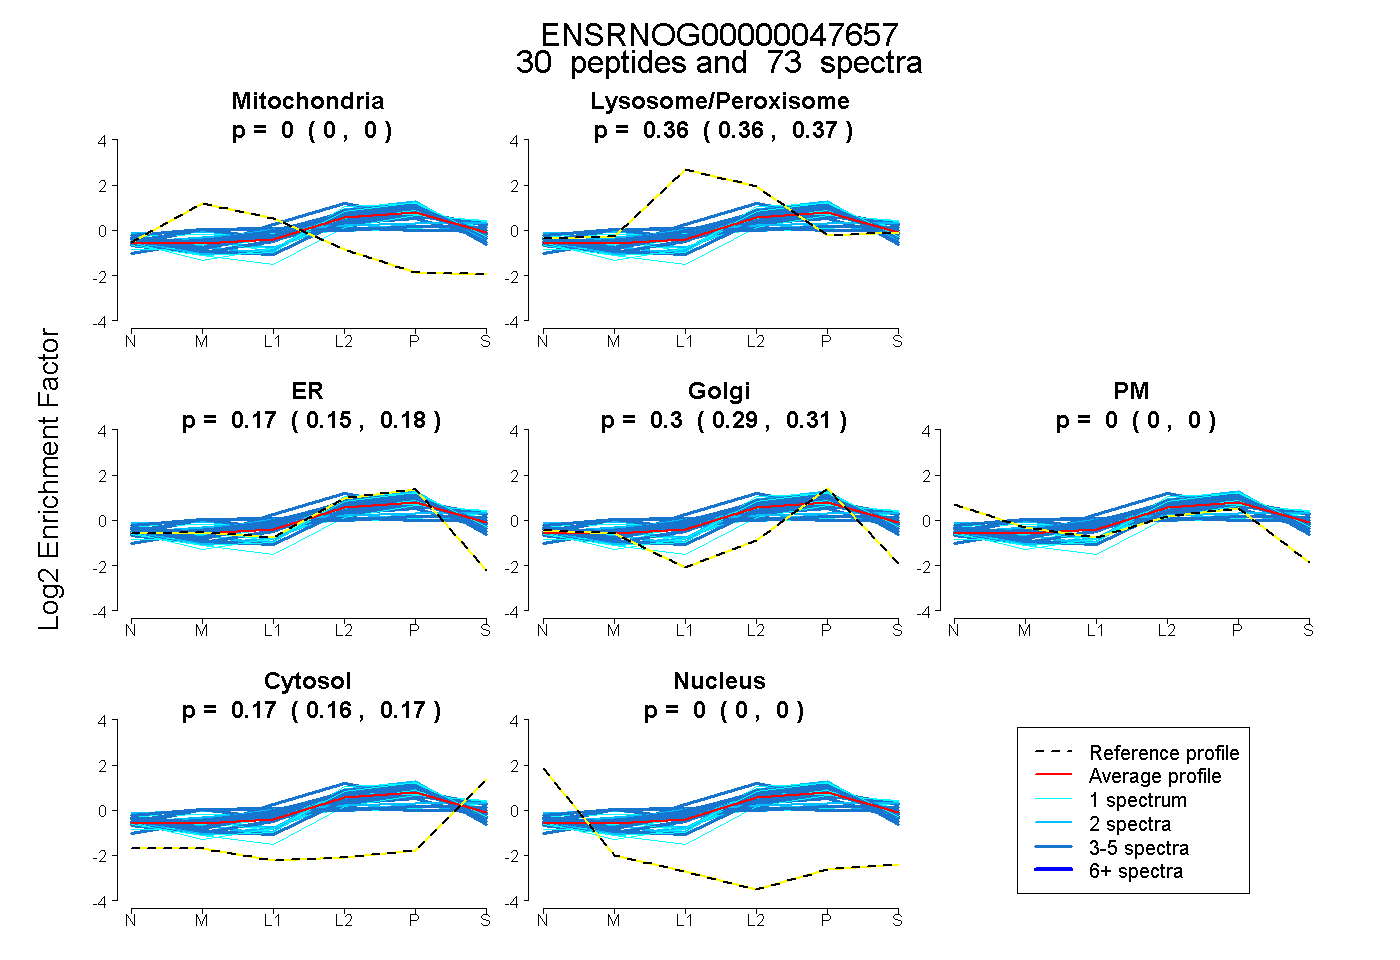
0.000 | 0.000
0.359 | 0.369
0.150 | 0.178
0.288 | 0.312
0.000 | 0.000
0.164 | 0.172
0.000 | 0.000
63peptides
spectra
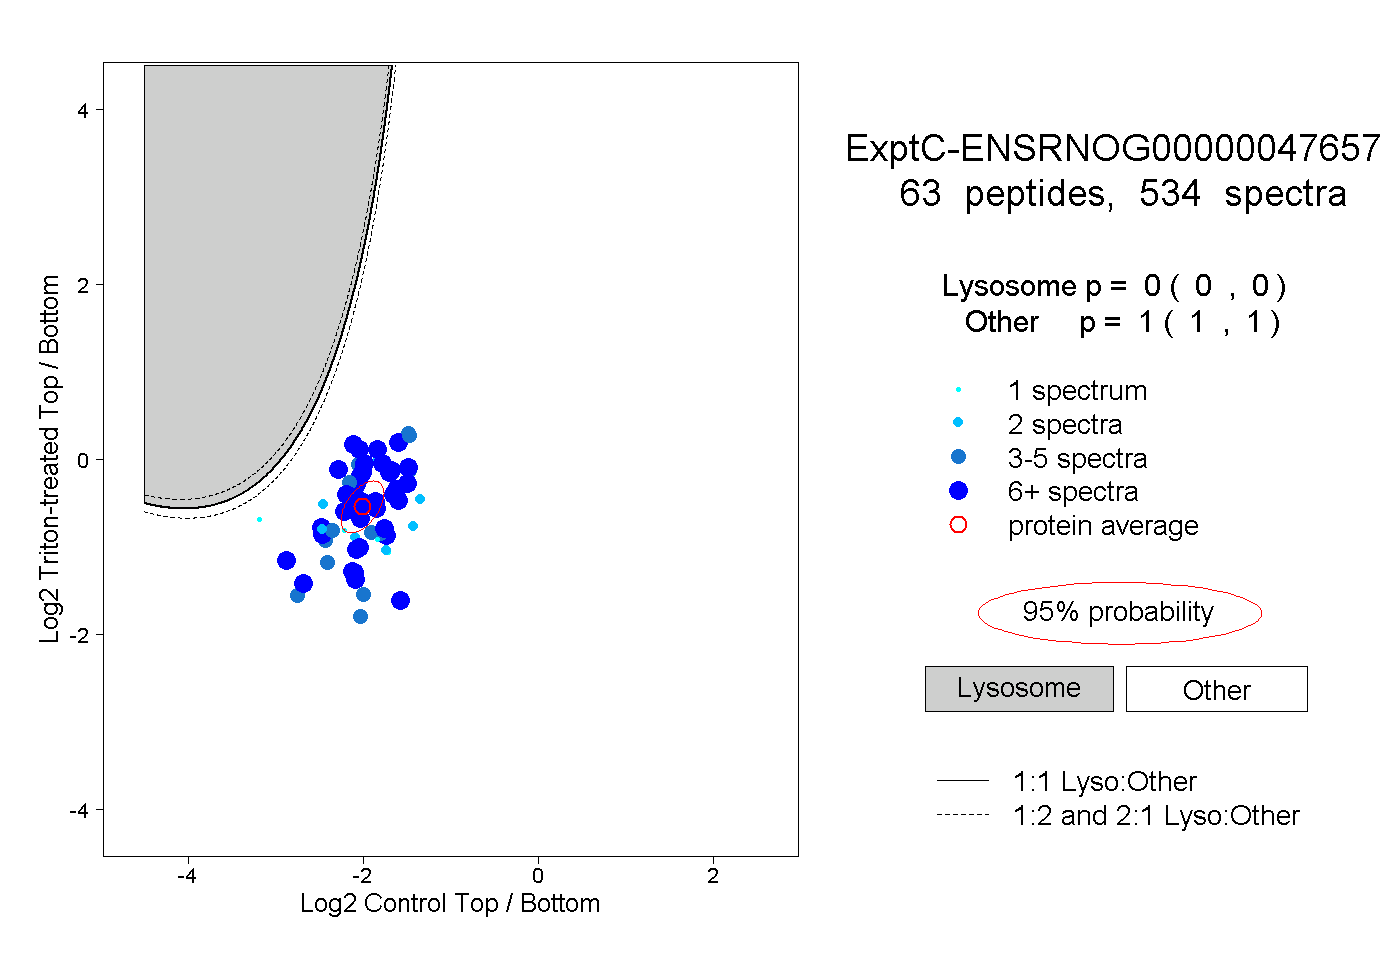
0.000 | 0.000
1.000 | 1.000
19peptides
spectra
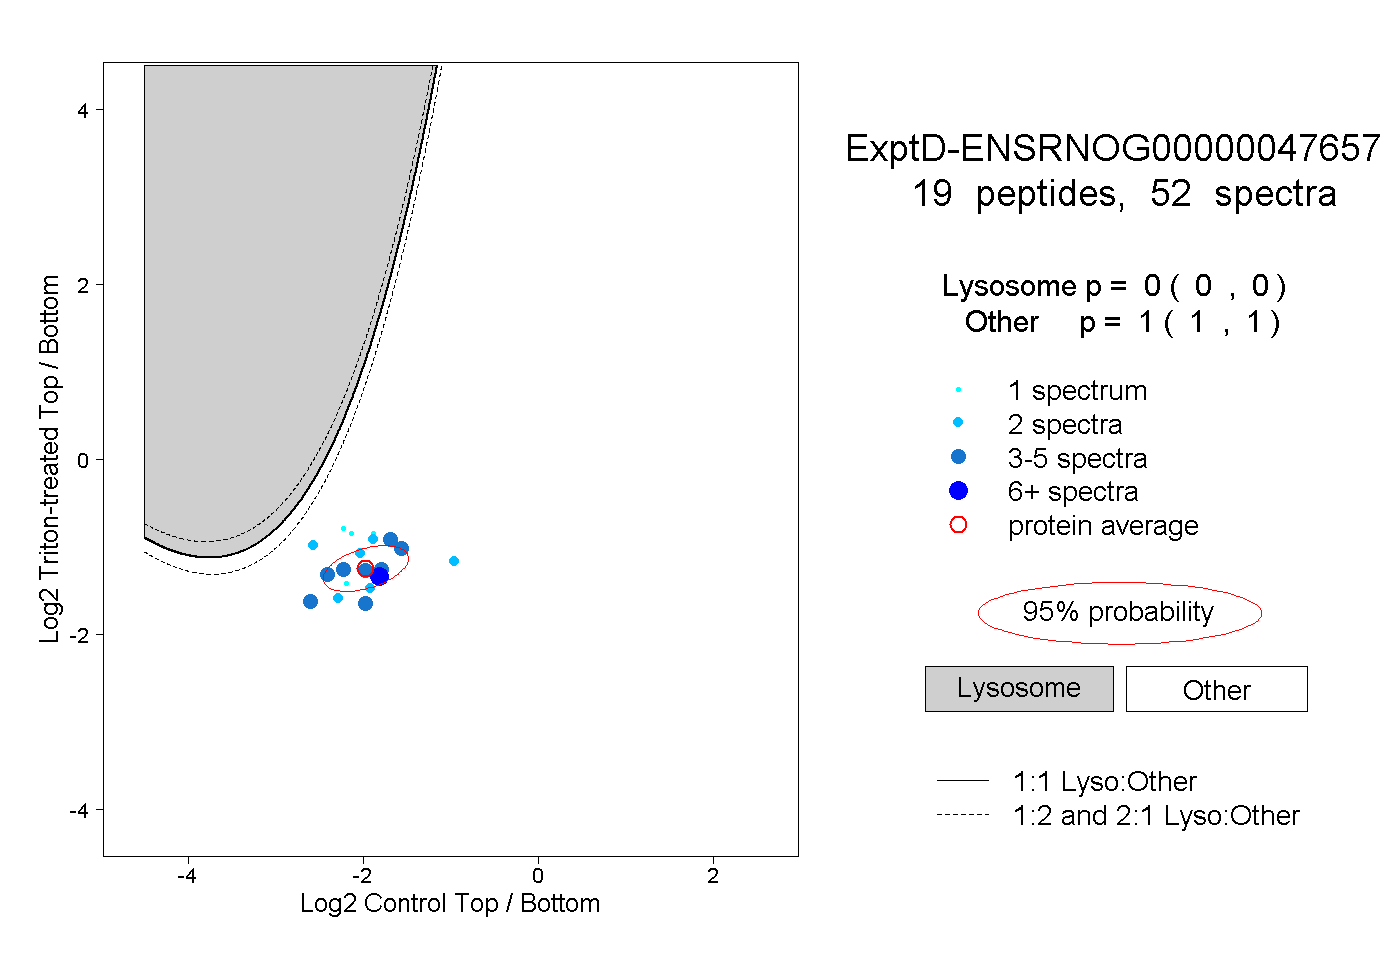
0.000 | 0.000
1.000 | 1.000