GPS1
[ENSRNOP00000066704]
Main page
| | | Plot |
Mito |
Lyso |
|
Perox |
ER |
Golgi |
PM |
Cytosol |
Nucleus |
|
| Expt A |
 13
13
peptides |
30
spectra |
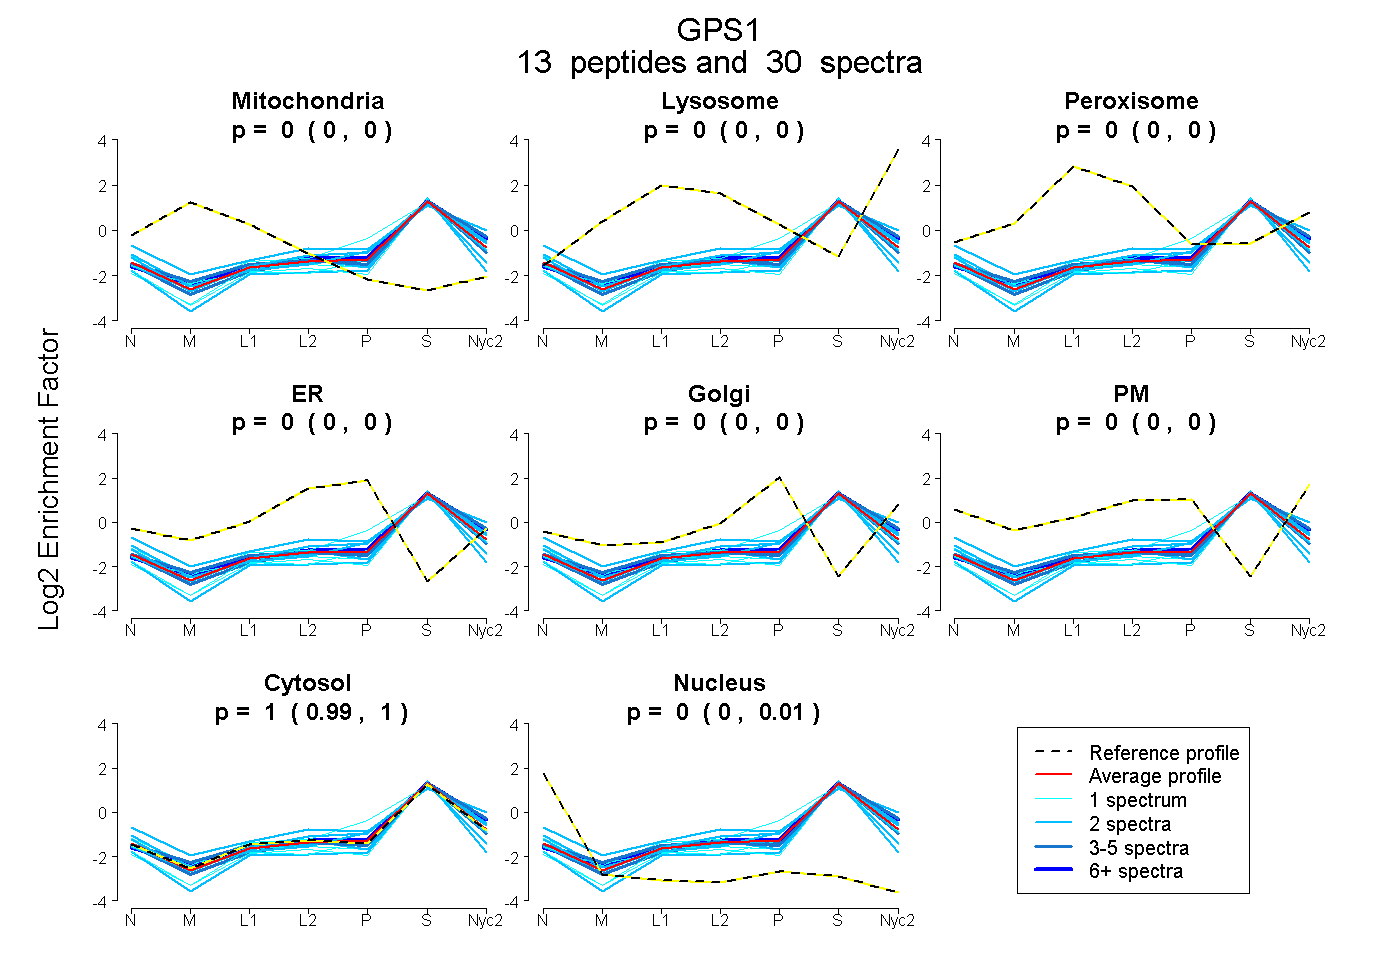 |
0.000
0.000 | 0.000 |
0.000
0.000 | 0.000 |
|
0.000
0.000 | 0.000 |
0.000
0.000 | 0.000 |
0.000
0.000 | 0.002 |
0.000
0.000 | 0.000 |
0.998
0.993 | 1.000 |
0.002
0.000 | 0.006 |
|
| | | Plot |
Mito |
|
Lyso or Perox |
|
ER |
Golgi |
PM |
Cytosol |
Nucleus |
|
| Expt B |
6
peptides |
11
spectra |
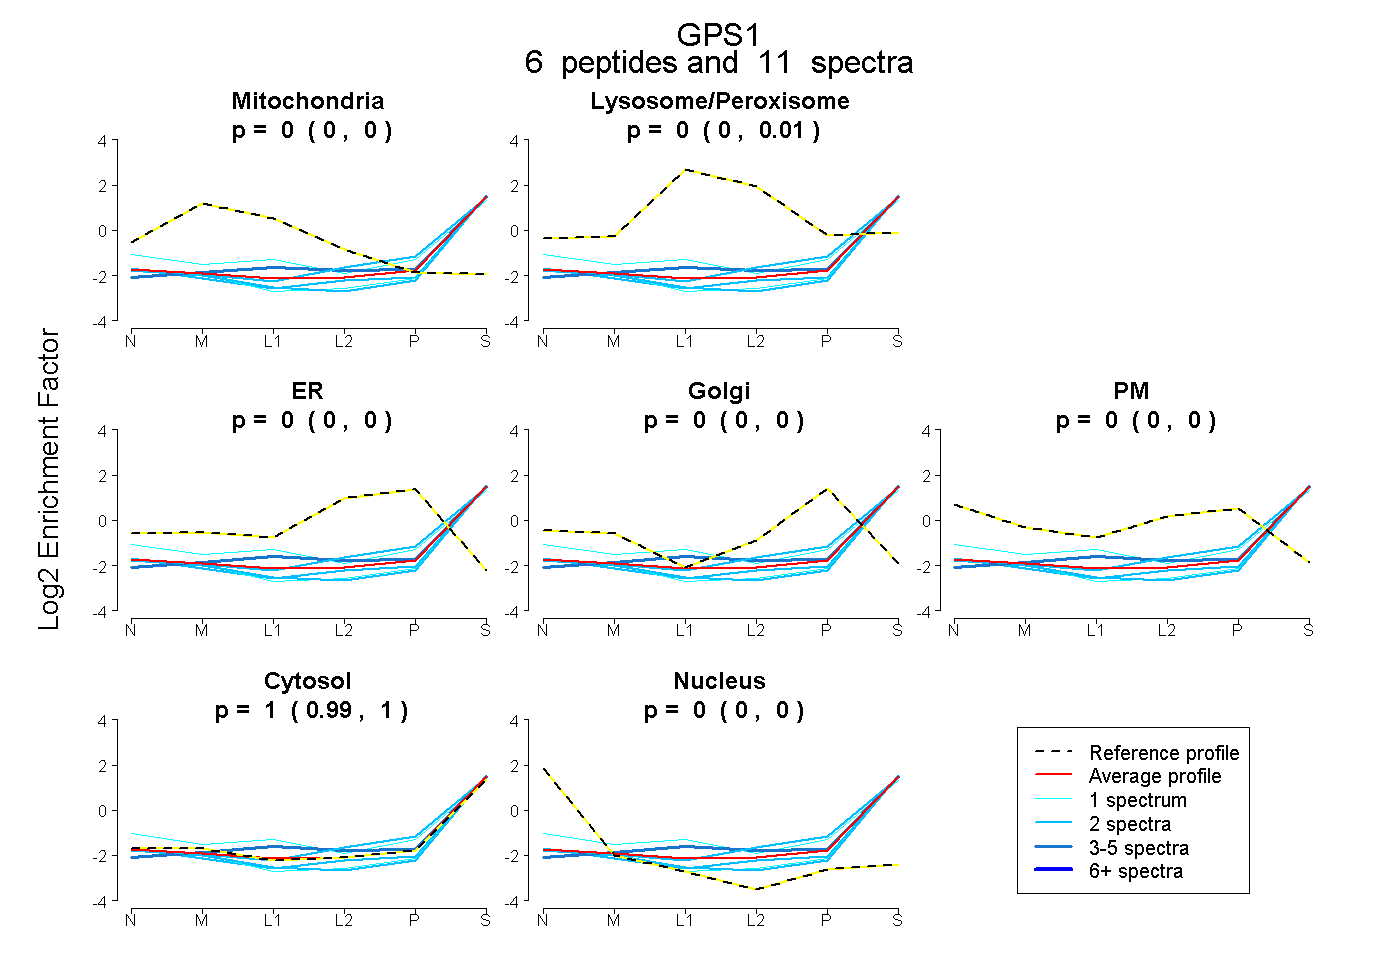 |
0.000
0.000 | 0.000 |
|
0.000
0.000 | 0.010 |
|
0.000
0.000 | 0.000 |
0.000
0.000 | 0.000 |
0.000
0.000 | 0.000 |
1.000
0.986 | 1.000 |
0.000
0.000 | 0.000 |
|
| 2 spectra, AESTPEIAEQR |
0.000 |
|
0.000 |
|
0.000 |
0.000 |
0.000 |
0.995 |
0.005 |
|
| 3 spectra, MALSFVQR |
0.000 |
|
0.067 |
|
0.000 |
0.000 |
0.000 |
0.933 |
0.000 |
|
| 1 spectrum, CAAGLAELAAR |
0.000 |
|
0.000 |
|
0.000 |
0.000 |
0.000 |
0.987 |
0.013 |
|
| 2 spectra, LQFIADR |
0.000 |
|
0.000 |
|
0.000 |
0.000 |
0.000 |
0.981 |
0.019 |
|
| 2 spectra, TLYTQIR |
0.000 |
|
0.000 |
|
0.071 |
0.000 |
0.000 |
0.929 |
0.000 |
|
| 1 spectrum, DSQTQAILTK |
0.000 |
|
0.148 |
|
0.000 |
0.000 |
0.000 |
0.810 |
0.042 |
|
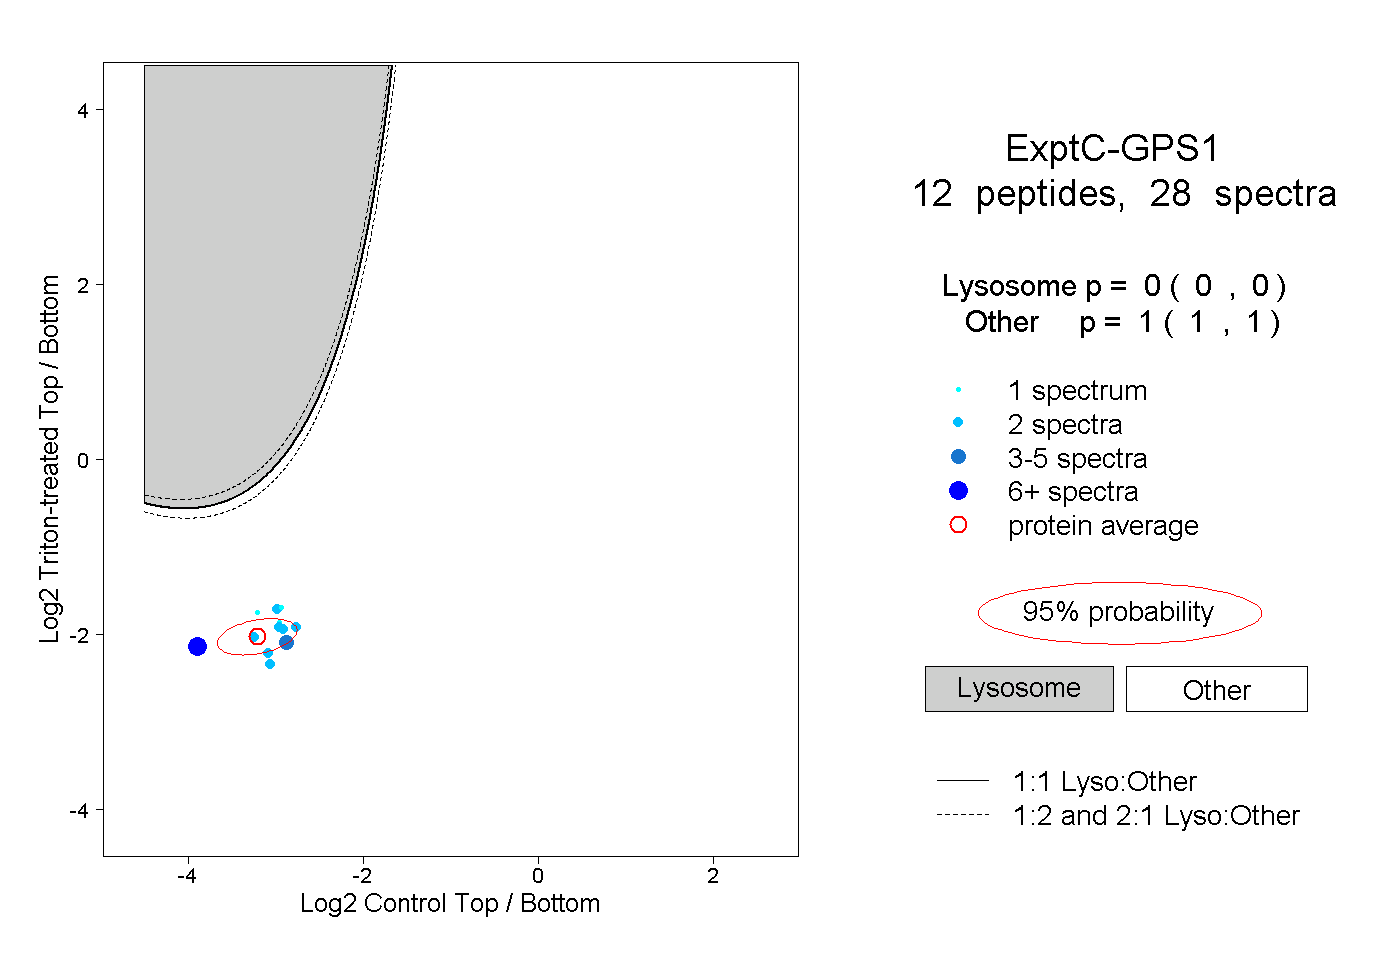
| | | Plot |
|
Lyso |
|
|
|
|
|
|
|
Other |
| Expt C |
12
peptides |
28
spectra |
 |
|
0.000
0.000 | 0.000 |
|
|
|
|
|
|
|
1.000
1.000 | 1.000 |
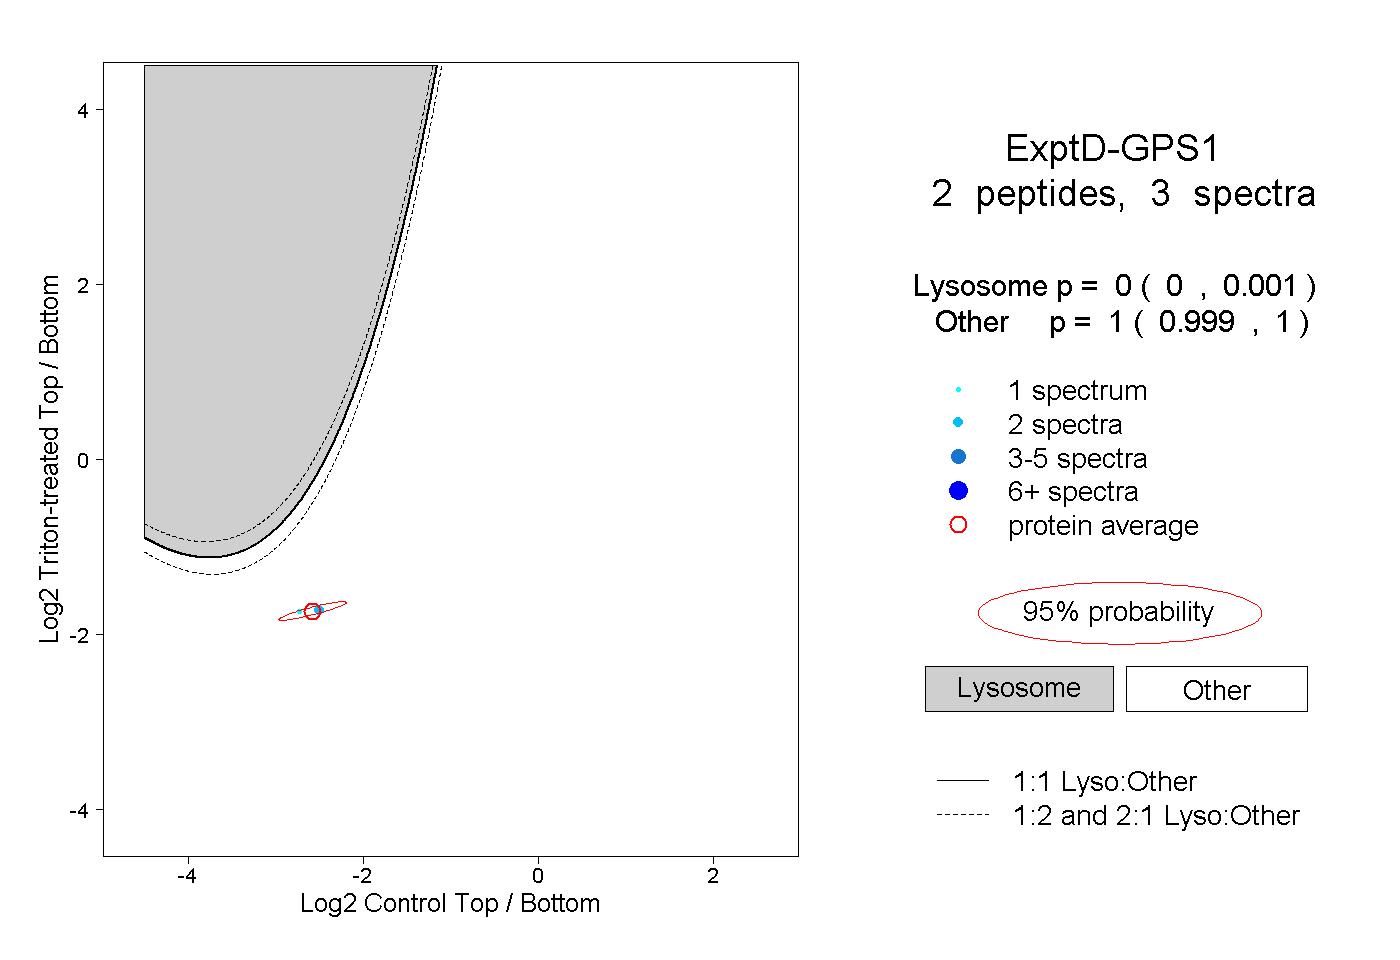
| | | Plot |
|
Lyso |
|
|
|
|
|
|
|
Other |
| Expt D |
2
peptides |
3
spectra |
 |
|
0.000
0.000 | 0.001 |
|
|
|
|
|
|
|
1.000
0.999 | 1.000 |