 5
5peptides
spectra
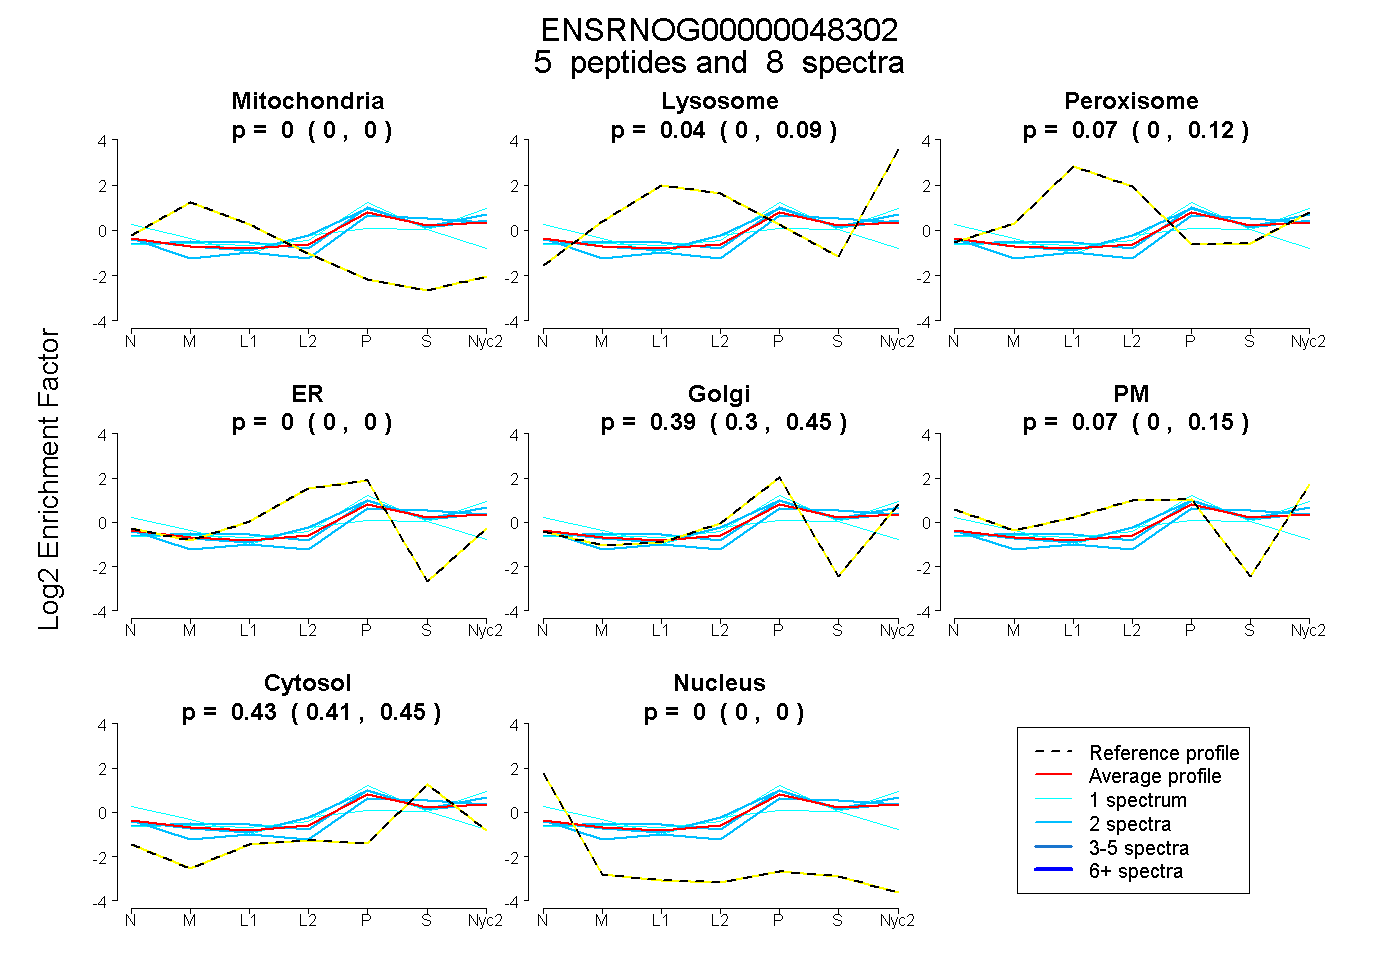
0.000 | 0.000
0.000 | 0.089
0.004 | 0.119
0.000 | 0.000
0.301 | 0.454
0.000 | 0.153
0.406 | 0.452
0.000 | 0.000
2peptides
spectra
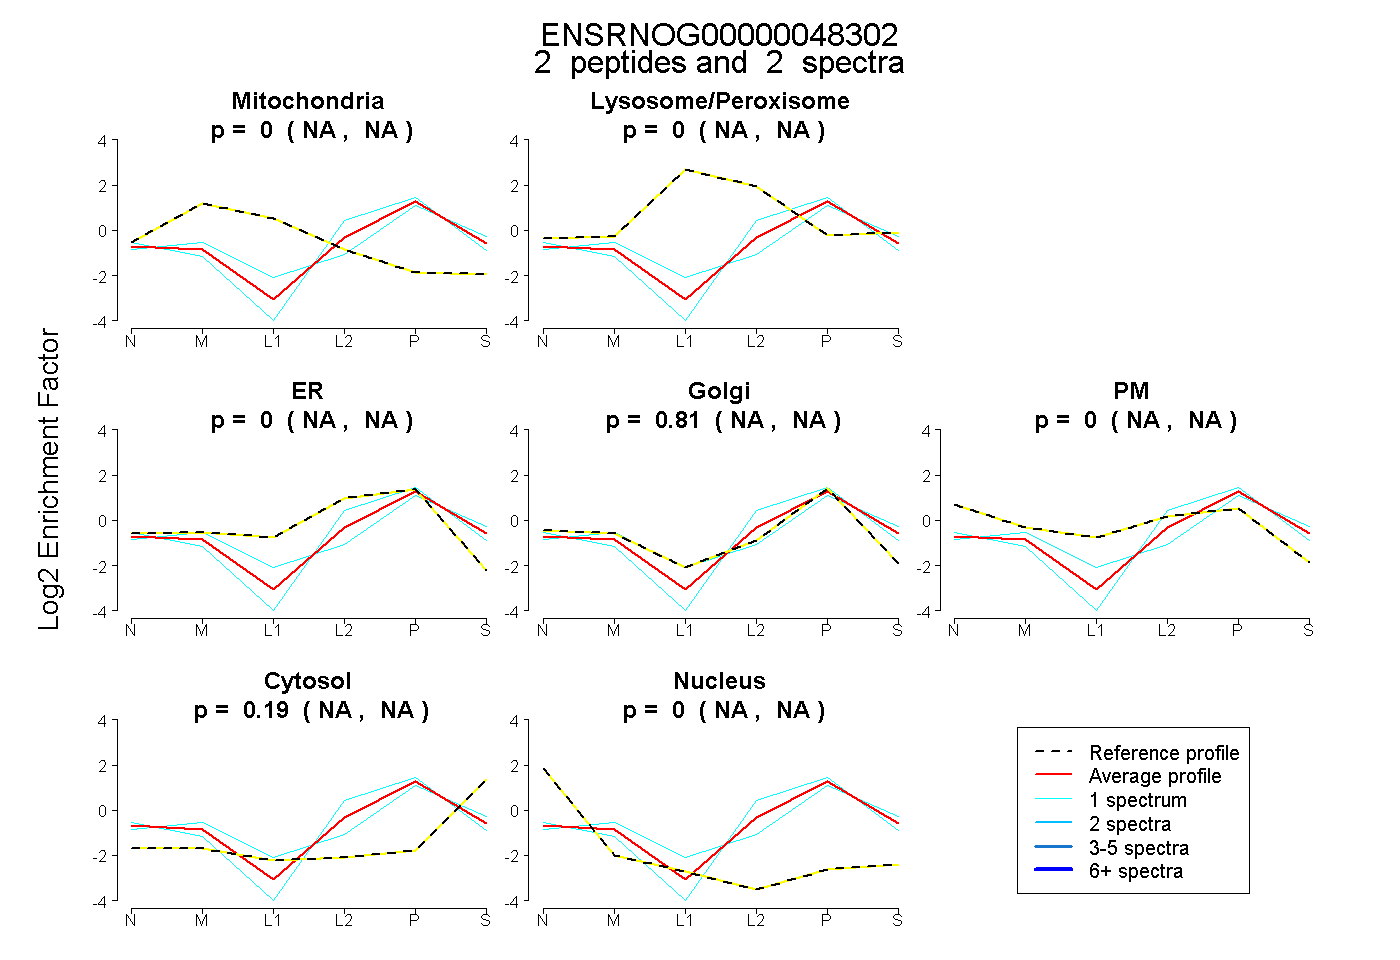
NA | NA
NA | NA
NA | NA
NA | NA
NA | NA
NA | NA
NA | NA
5peptides
spectra

0.000 | 0.000
1.000 | 1.000
1peptide
spectra
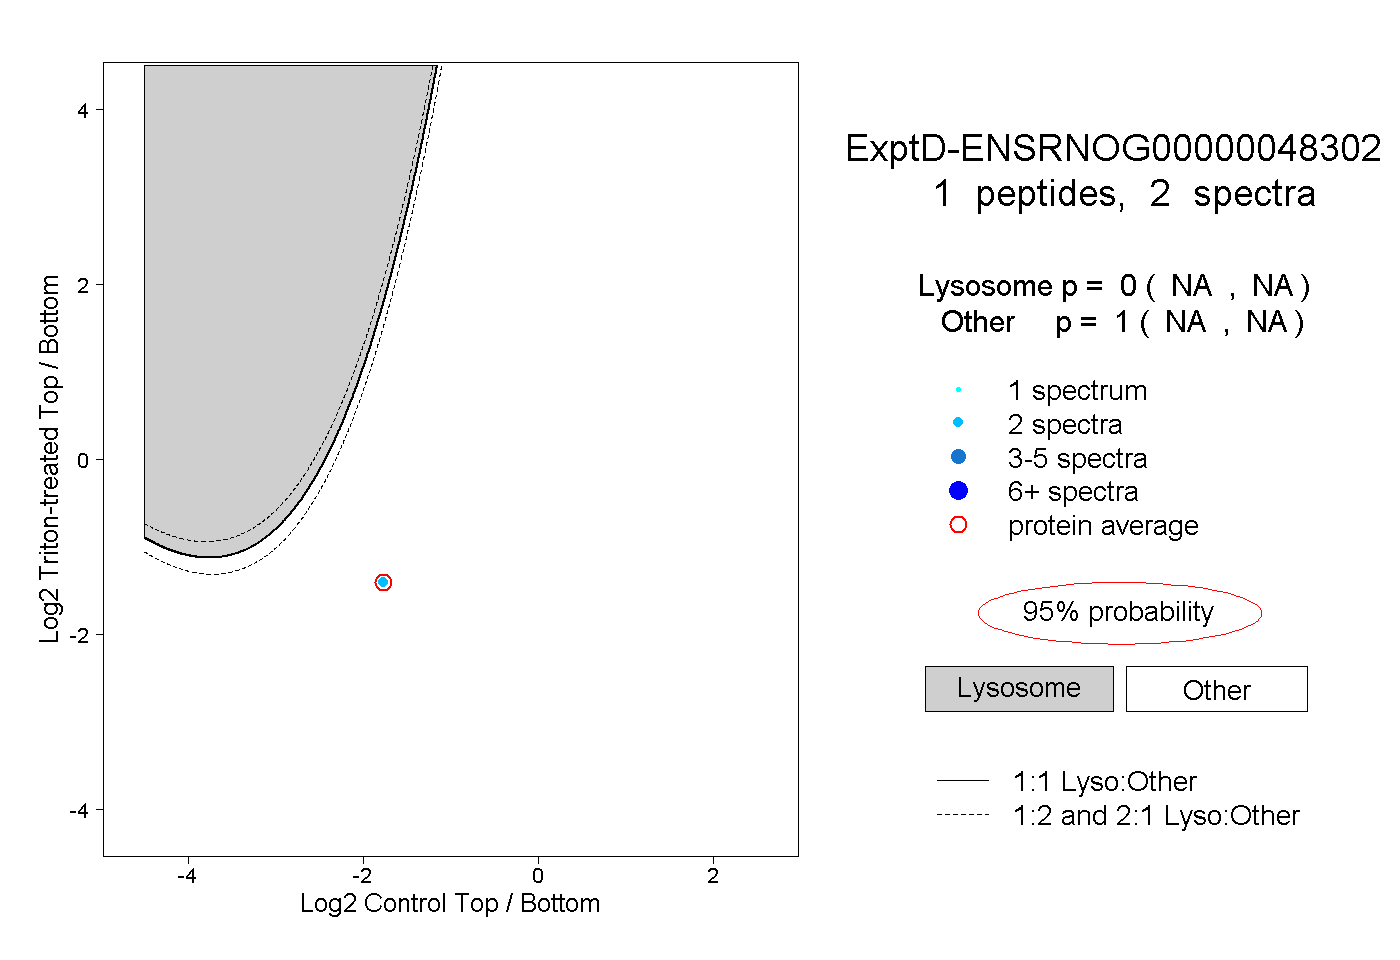
NA | NA
NA | NA