HK1
[ENSRNOP00000066611]
Main page
| | | Plot |
Mito |
Lyso |
|
Perox |
ER |
Golgi |
PM |
Cytosol |
Nucleus |
|
| Expt A |
 20
20
peptides |
60
spectra |
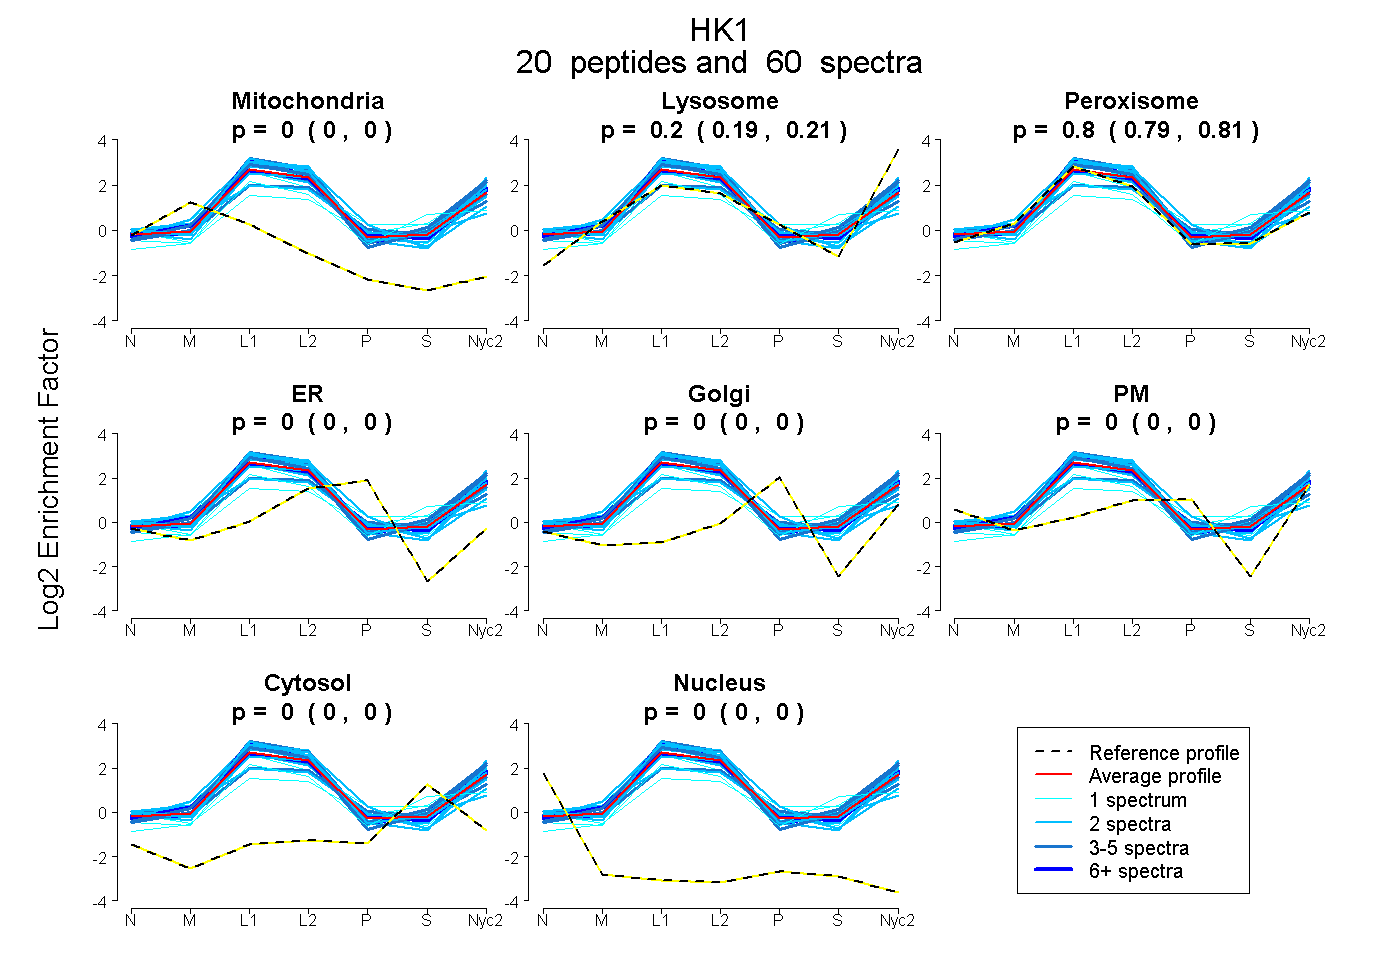 |
0.000
0.000 | 0.000 |
0.200
0.193 | 0.206 |
|
0.800
0.793 | 0.806 |
0.000
0.000 | 0.000 |
0.000
0.000 | 0.000 |
0.000
0.000 | 0.000 |
0.000
0.000 | 0.000 |
0.000
0.000 | 0.000 |
|
| | | Plot |
Mito |
|
Lyso or Perox |
|
ER |
Golgi |
PM |
Cytosol |
Nucleus |
|
| Expt B |
6
peptides |
9
spectra |
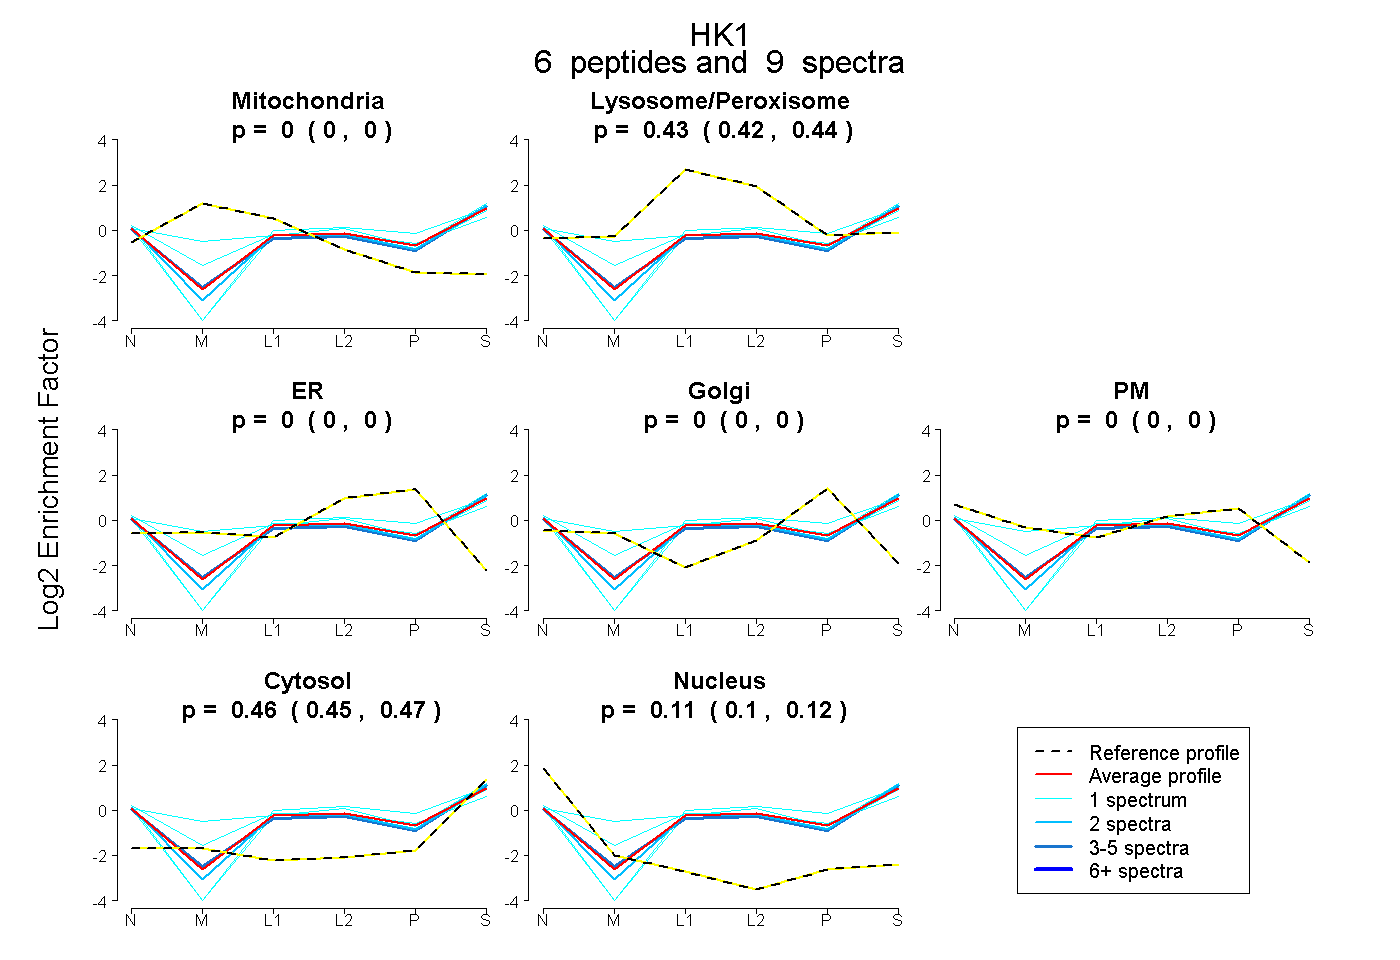 |
0.000
0.000 | 0.000 |
|
0.430
0.419 | 0.438 |
|
0.000
0.000 | 0.000 |
0.000
0.000 | 0.000 |
0.000
0.000 | 0.000 |
0.461
0.450 | 0.470 |
0.109
0.100 | 0.116 |
|
| 1 spectrum, LVPDSDVR |
0.000 |
|
0.450 |
|
0.000 |
0.000 |
0.026 |
0.410 |
0.114 |
|
| 1 spectrum, GQISEPLK |
0.000 |
|
0.345 |
|
0.000 |
0.000 |
0.260 |
0.387 |
0.008 |
|
| 1 spectrum, GAALITAVGVR |
0.000 |
|
0.451 |
|
0.005 |
0.000 |
0.000 |
0.441 |
0.103 |
|
| 2 spectra, NILIDFTK |
0.000 |
|
0.403 |
|
0.000 |
0.000 |
0.000 |
0.490 |
0.107 |
|
| 3 spectra, LALLQVR |
0.000 |
|
0.397 |
|
0.000 |
0.000 |
0.000 |
0.501 |
0.102 |
|
| 1 spectrum, FLSQIESDR |
0.000 |
|
0.403 |
|
0.000 |
0.000 |
0.000 |
0.508 |
0.089 |
|
| | | Plot |
|
Lyso |
|
|
|
|
|
|
|
Other |
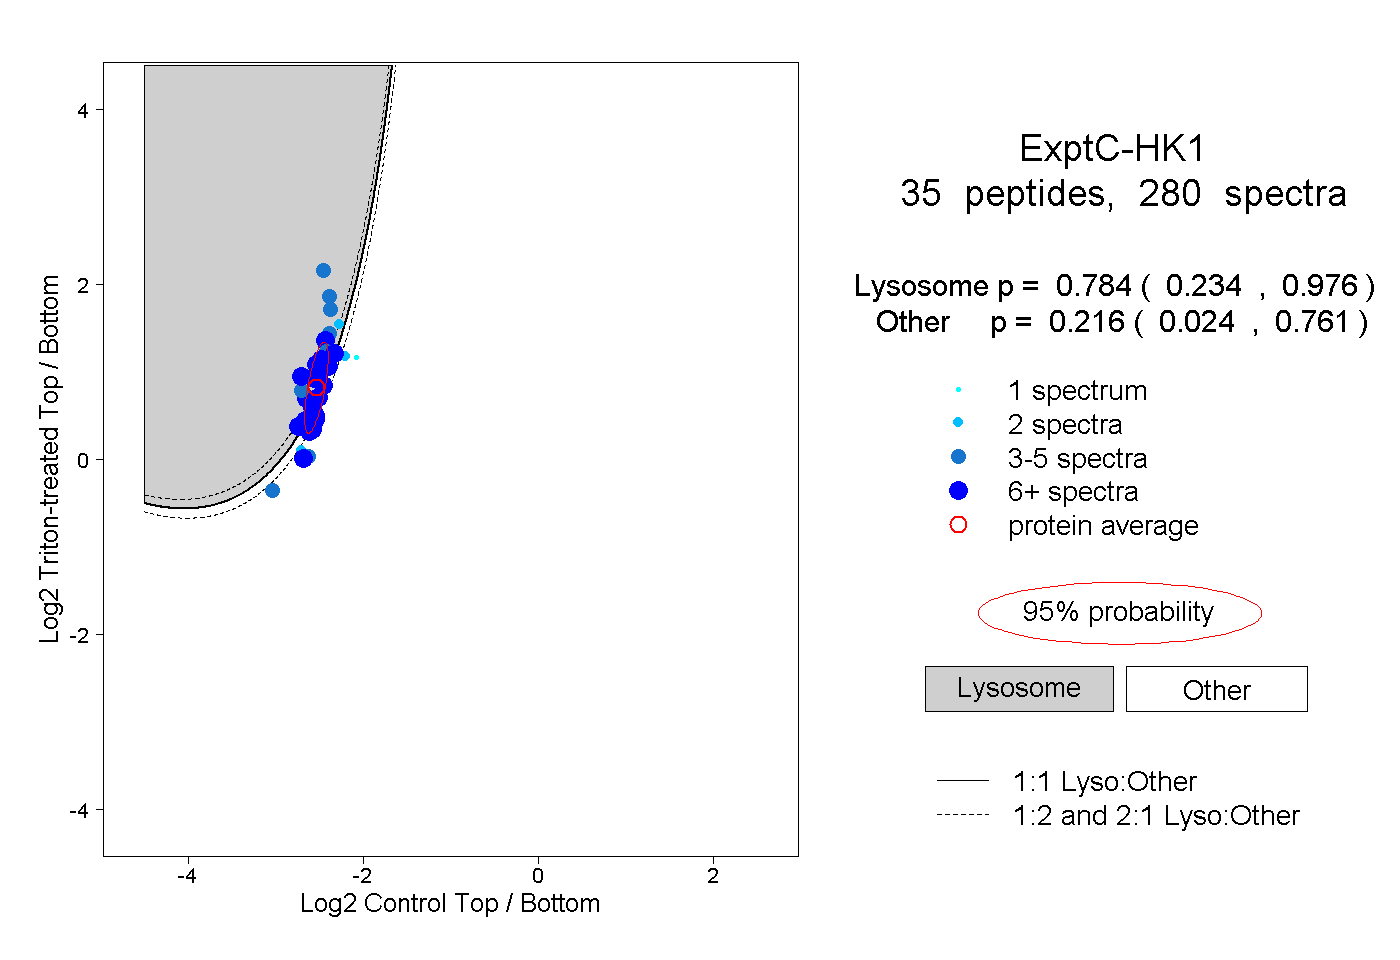
| Expt C |
35
peptides |
280
spectra |
 |
|
0.784
0.234 | 0.976 |
|
|
|
|
|
|
|
0.216
0.024 | 0.761 |
| | | Plot |
|
Lyso |
|
|
|
|
|
|
|
Other |
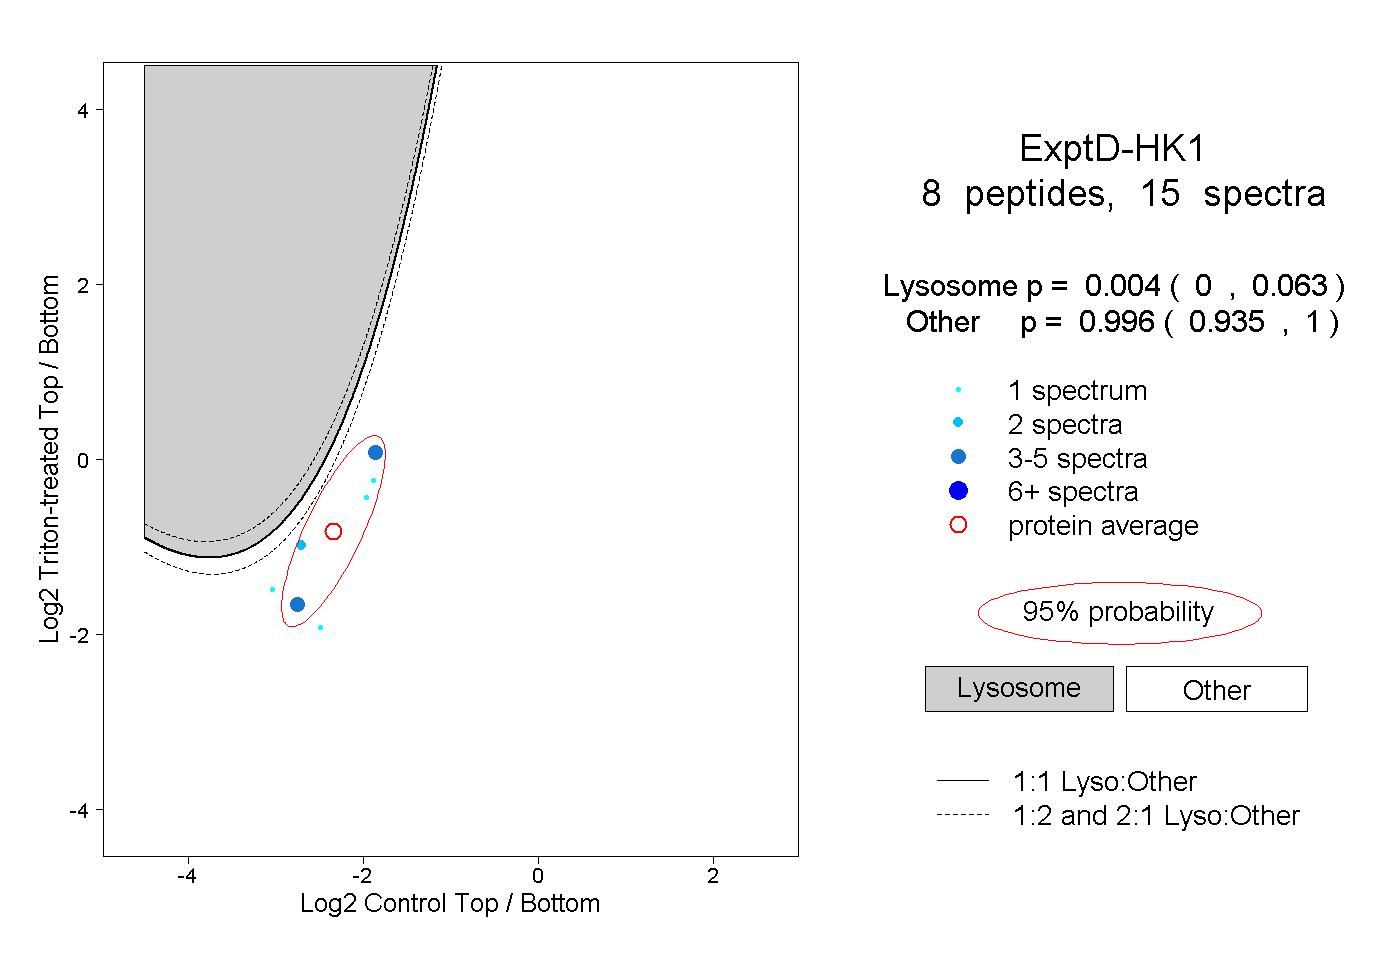
| Expt D |
8
peptides |
15
spectra |
 |
|
0.004
0.000 | 0.063 |
|
|
|
|
|
|
|
0.996
0.935 | 1.000 |