SBF1
[ENSRNOP00000066598]
Main page
| | | Plot |
Mito |
Lyso |
|
Perox |
ER |
Golgi |
PM |
Cytosol |
Nucleus |
|
| Expt A |
 29
29
peptides |
53
spectra |
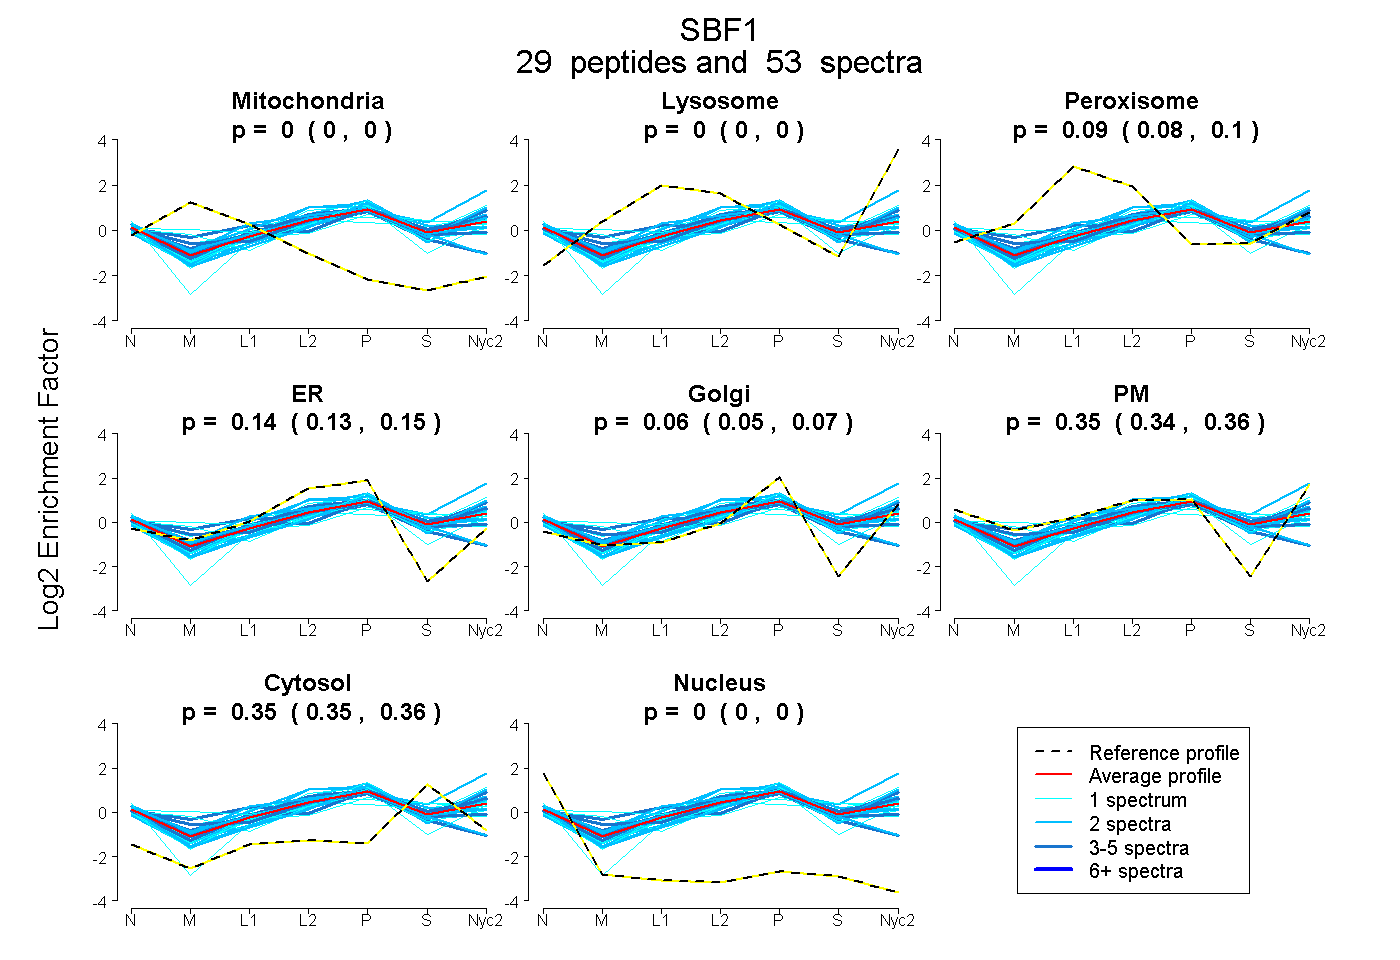 |
0.000
0.000 | 0.000 |
0.000
0.000 | 0.000 |
|
0.090
0.084 | 0.096 |
0.142
0.128 | 0.155 |
0.064
0.049 | 0.075 |
0.352
0.342 | 0.360 |
0.352
0.348 | 0.356 |
0.000
0.000 | 0.000 |
|
| | | Plot |
Mito |
|
Lyso or Perox |
|
ER |
Golgi |
PM |
Cytosol |
Nucleus |
|
| Expt B |
8
peptides |
10
spectra |
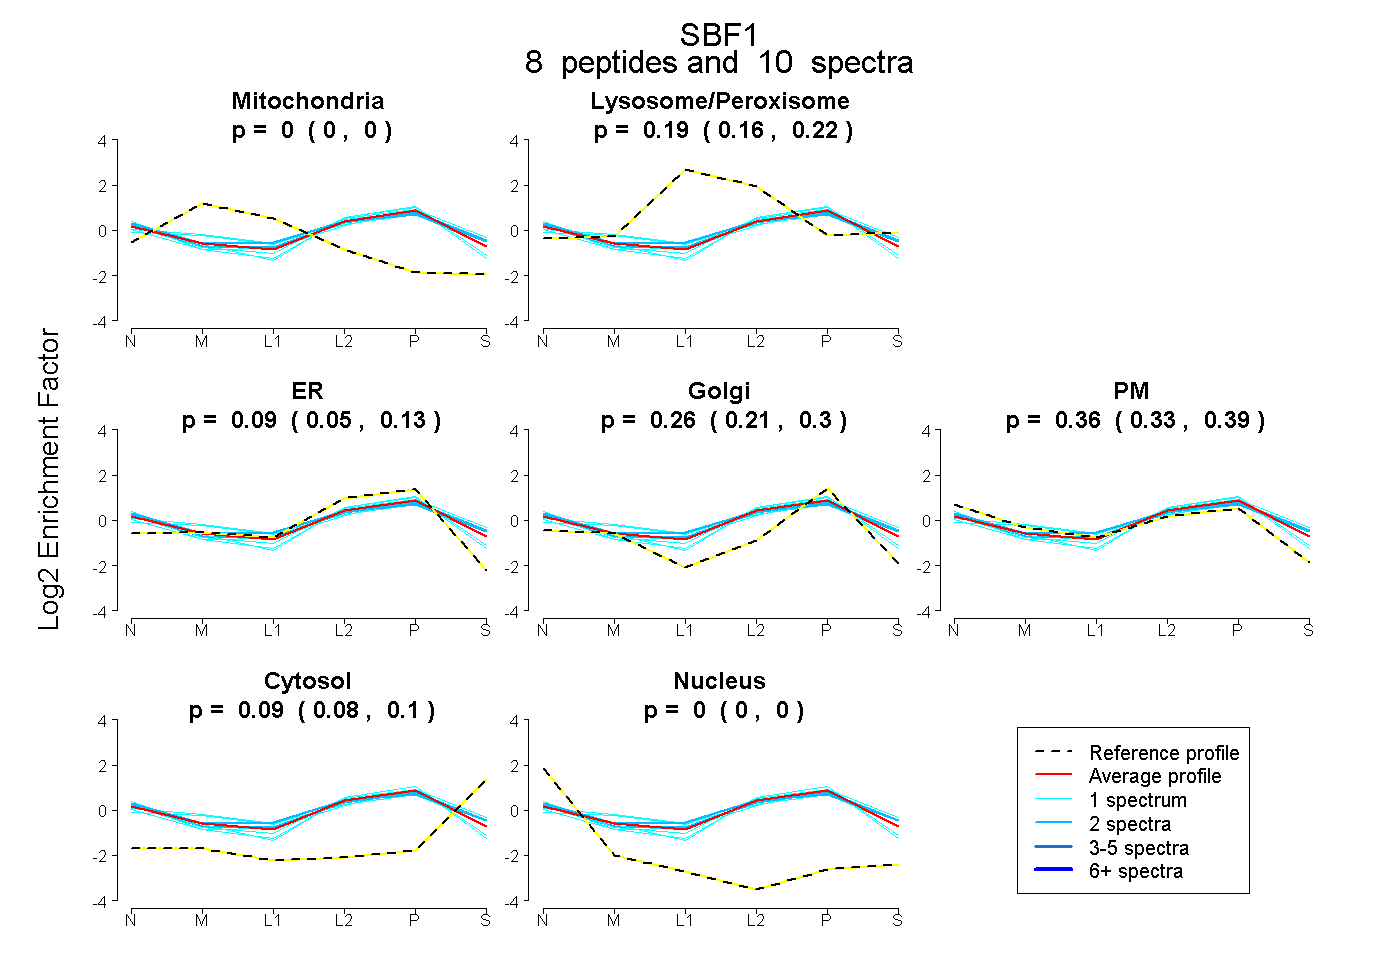 |
0.000
0.000 | 0.000 |
|
0.192
0.164 | 0.215 |
|
0.091
0.045 | 0.131 |
0.264
0.215 | 0.304 |
0.362
0.332 | 0.388 |
0.091
0.076 | 0.103 |
0.000
0.000 | 0.000 |
|
| | | Plot |
|
Lyso |
|
|
|
|
|
|
|
Other |
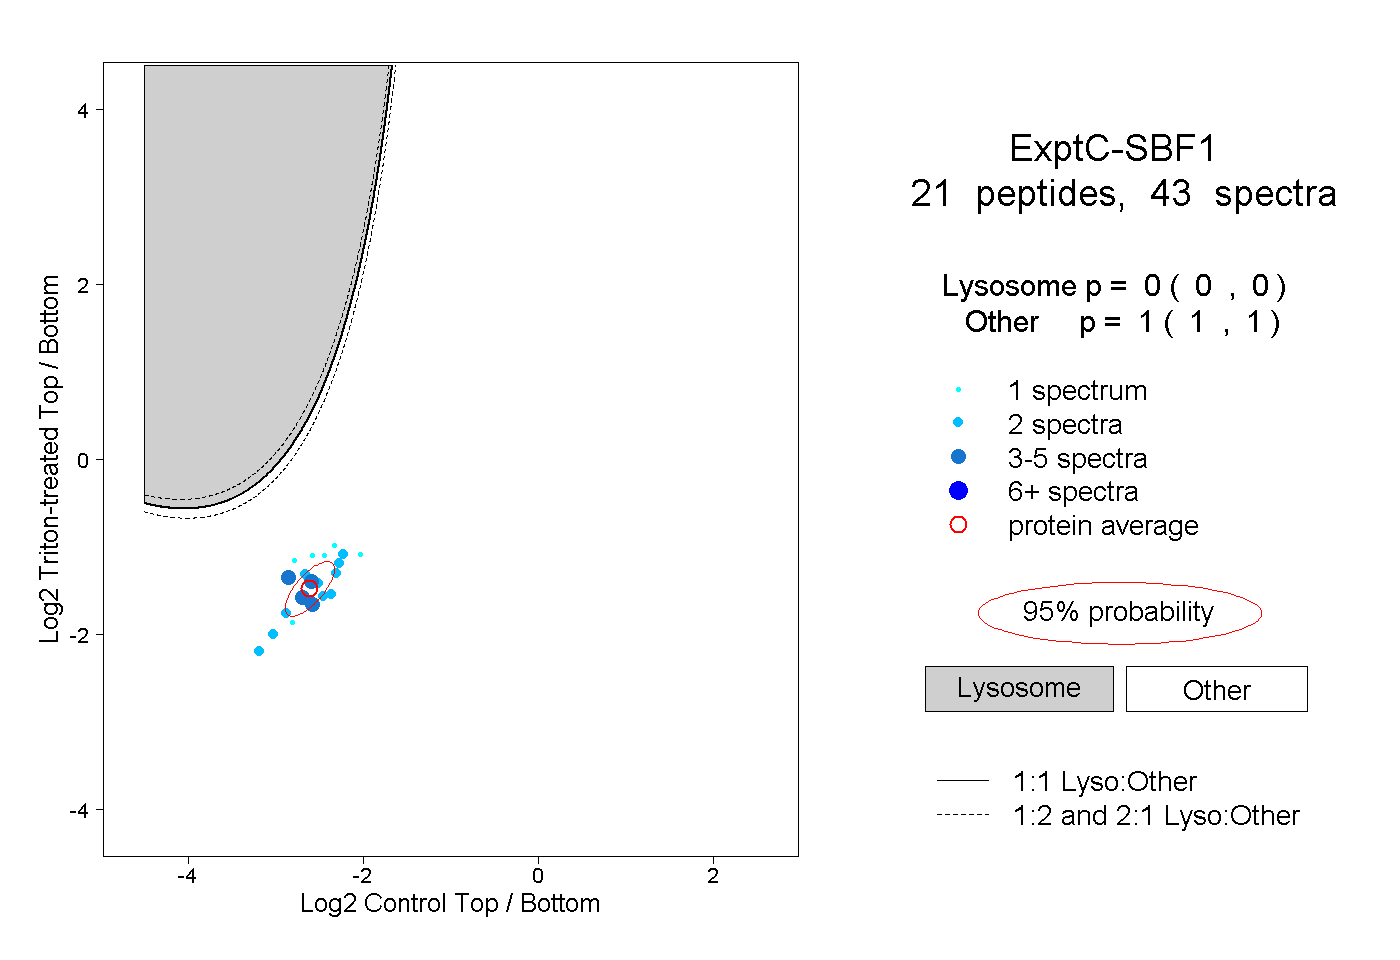
| Expt C |
21
peptides |
43
spectra |
 |
|
0.000
0.000 | 0.000 |
|
|
|
|
|
|
|
1.000
1.000 | 1.000 |
| 4 spectra, SALDVASEQR |
|
0.000 |
|
|
|
|
|
|
|
1.000 |
| 1 spectrum, LLEELQR |
|
0.000 |
|
|
|
|
|
|
|
1.000 |
| 2 spectra, LDHADVFR |
|
0.000 |
|
|
|
|
|
|
|
1.000 |
| 4 spectra, VDTECK |
|
0.000 |
|
|
|
|
|
|
|
1.000 |
| 2 spectra, LETELGRPSER |
|
0.000 |
|
|
|
|
|
|
|
1.000 |
| 1 spectrum, NCISYVFEGK |
|
0.000 |
|
|
|
|
|
|
|
1.000 |
| 2 spectra, LLPAVLR |
|
0.000 |
|
|
|
|
|
|
|
1.000 |
| 1 spectrum, MQGAPPAVK |
|
0.000 |
|
|
|
|
|
|
|
1.000 |
| 2 spectra, IHPEPVIR |
|
0.000 |
|
|
|
|
|
|
|
1.000 |
| 1 spectrum, SGGLHGK |
|
0.000 |
|
|
|
|
|
|
|
1.000 |
| 2 spectra, LPPIQKPK |
|
0.000 |
|
|
|
|
|
|
|
1.000 |
| 2 spectra, SCTFQLLK |
|
0.000 |
|
|
|
|
|
|
|
1.000 |
| 1 spectrum, TIEGFR |
|
0.000 |
|
|
|
|
|
|
|
1.000 |
| 2 spectra, VQPDAISR |
|
0.000 |
|
|
|
|
|
|
|
1.000 |
| 4 spectra, TISLGAGDR |
|
0.000 |
|
|
|
|
|
|
|
1.000 |
| 2 spectra, TFLLDSDYER |
|
0.000 |
|
|
|
|
|
|
|
1.000 |
| 1 spectrum, AFFDVK |
|
0.000 |
|
|
|
|
|
|
|
1.000 |
| 4 spectra, VLFLSR |
|
0.000 |
|
|
|
|
|
|
|
1.000 |
| 2 spectra, AAFLGQR |
|
0.000 |
|
|
|
|
|
|
|
1.000 |
| 2 spectra, SYEGTLYK |
|
0.000 |
|
|
|
|
|
|
|
1.000 |
| 1 spectrum, SVWEYVDR |
|
0.000 |
|
|
|
|
|
|
|
1.000 |
| | | Plot |
|
Lyso |
|
|
|
|
|
|
|
Other |
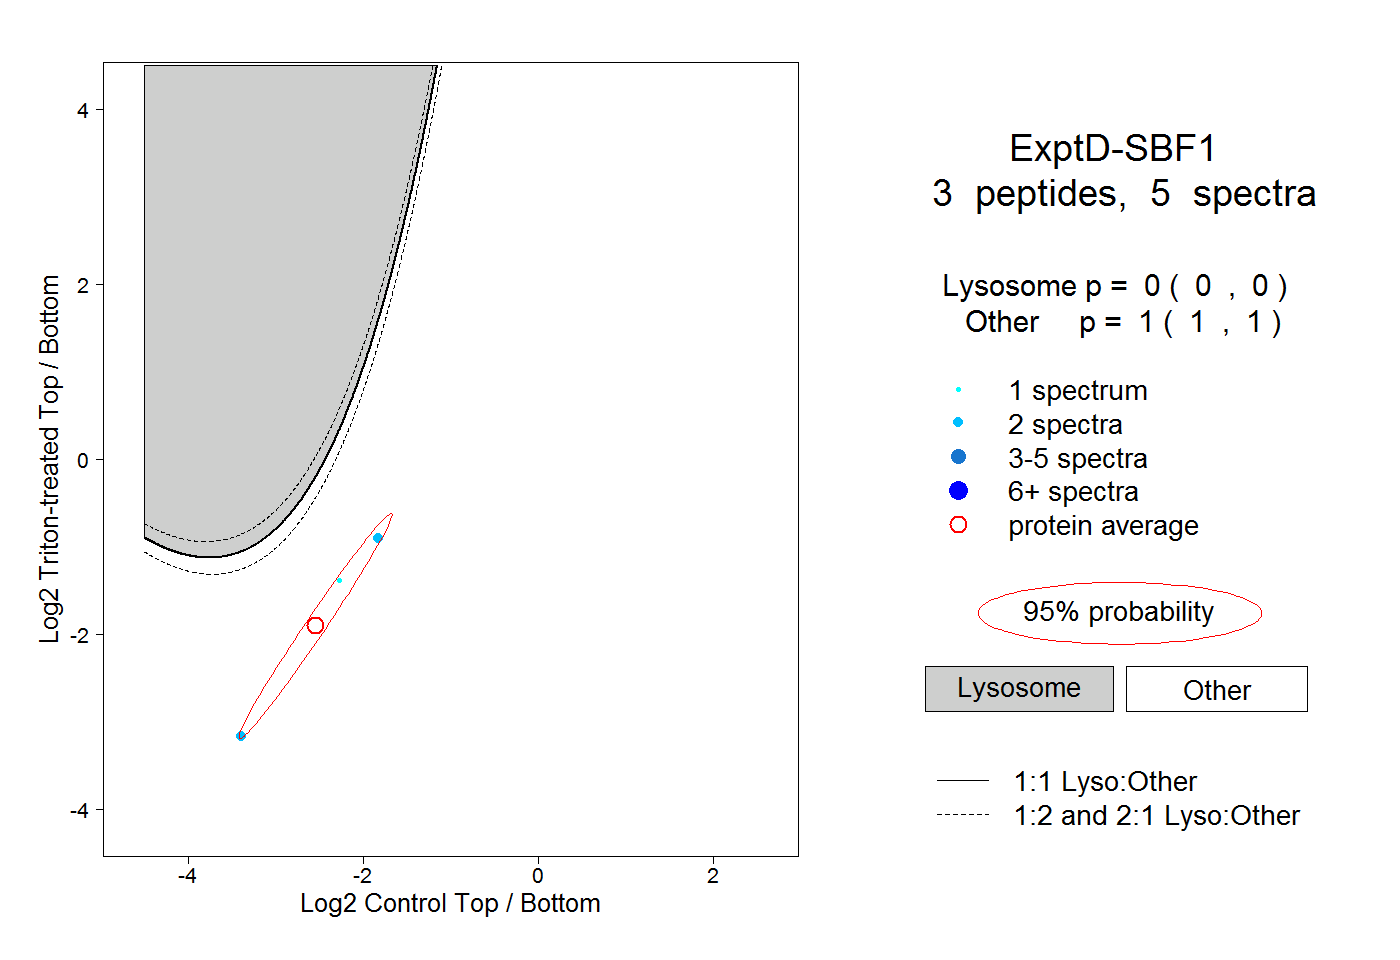
| Expt D |
3
peptides |
5
spectra |
 |
|
0.000
0.000 | 0.000 |
|
|
|
|
|
|
|
1.000
1.000 | 1.000 |