29
29peptides
spectra
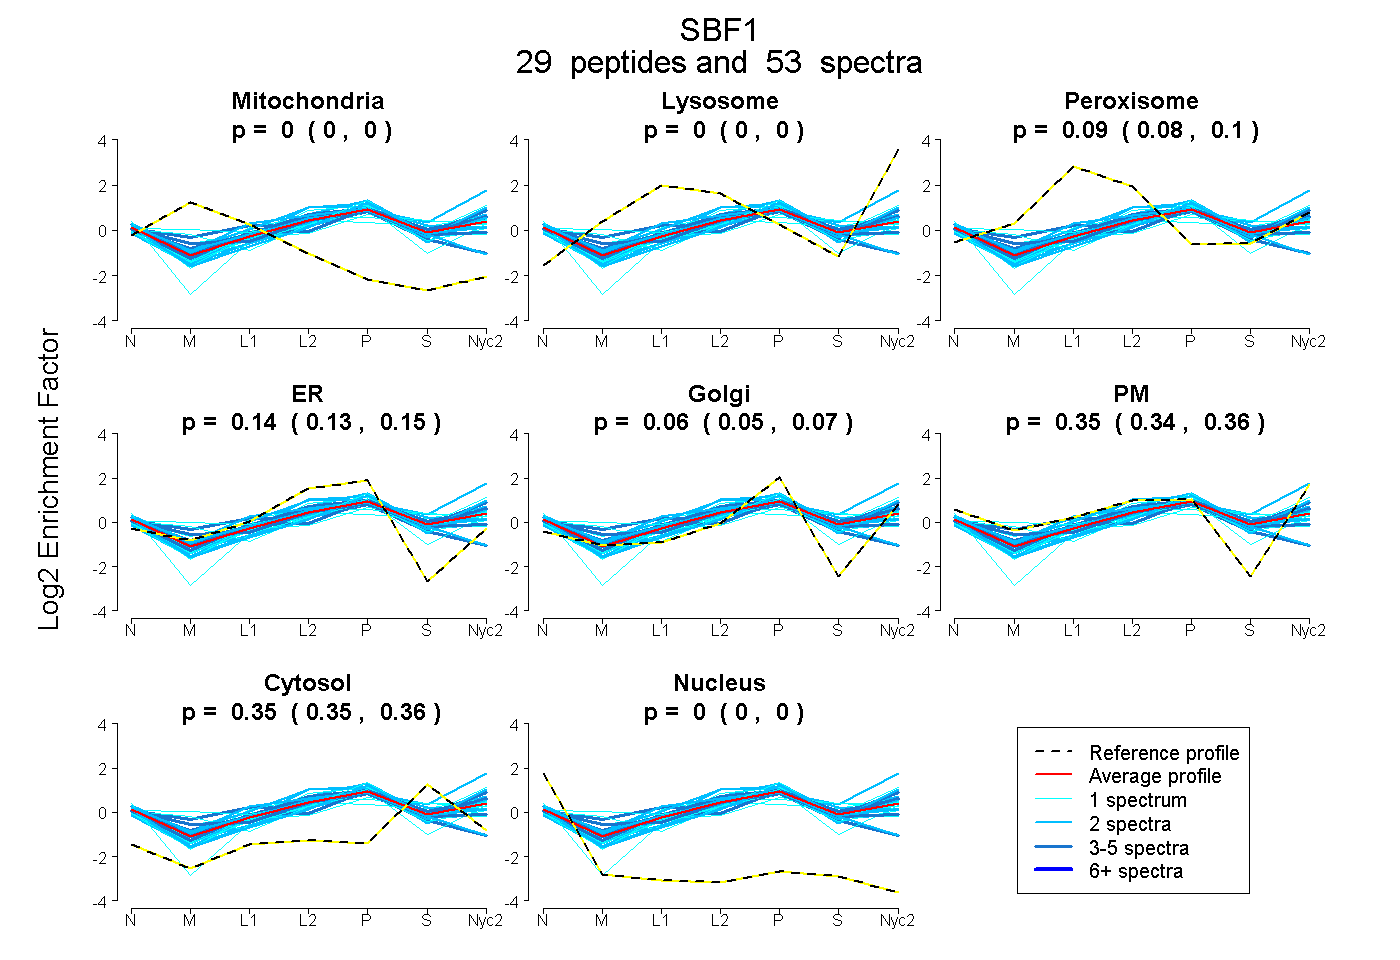
0.000 | 0.000
0.000 | 0.000
0.084 | 0.096
0.128 | 0.155
0.049 | 0.075
0.342 | 0.360
0.348 | 0.356
0.000 | 0.000
8peptides
spectra
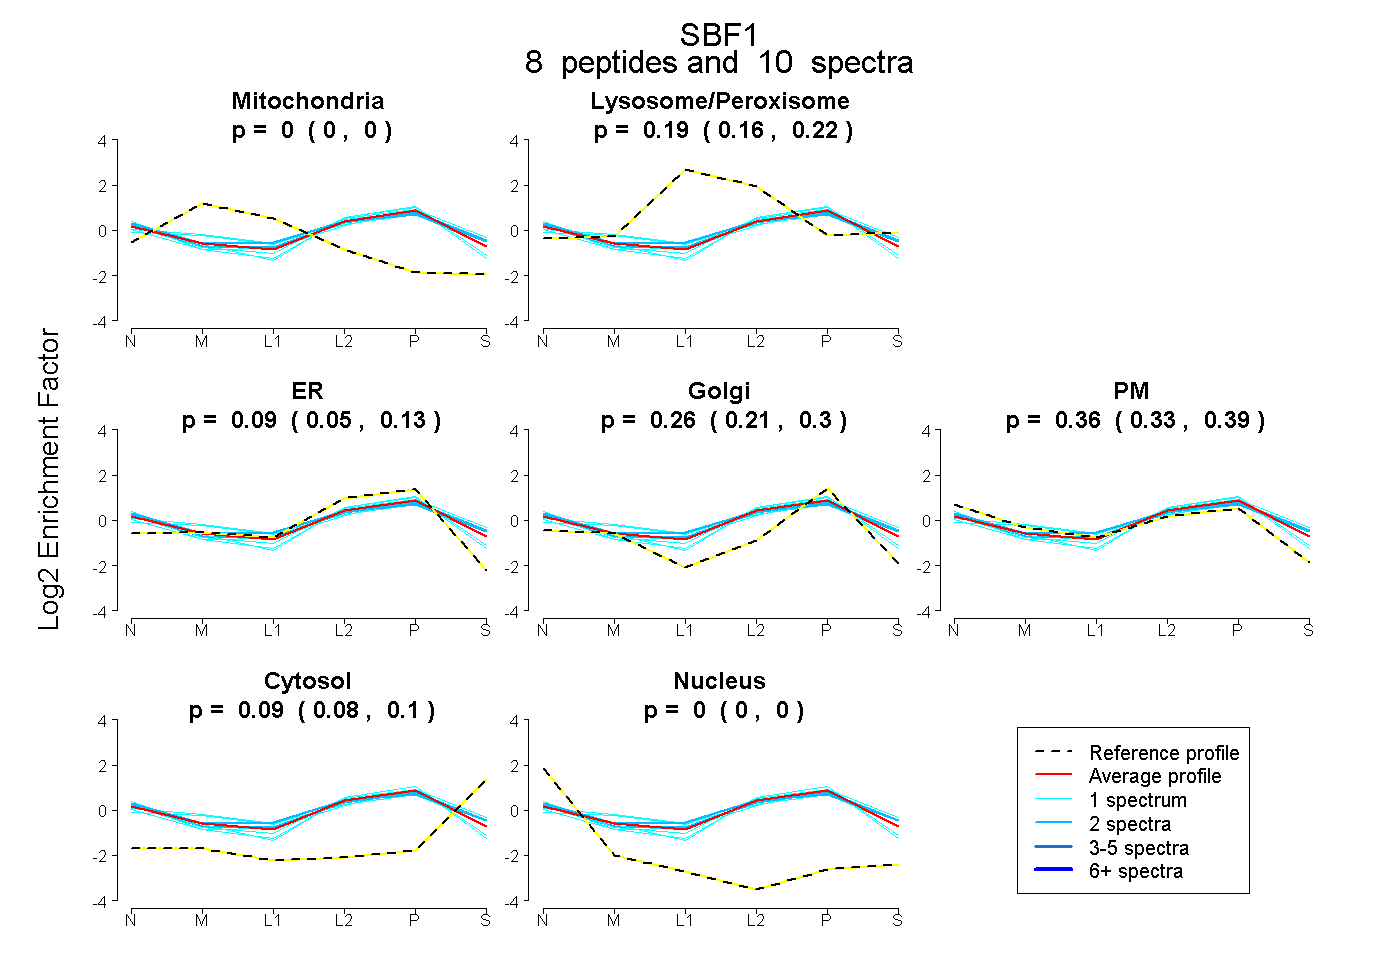
0.000 | 0.000
0.164 | 0.215
0.045 | 0.131
0.215 | 0.304
0.332 | 0.388
0.076 | 0.103
0.000 | 0.000