 9
9peptides
spectra
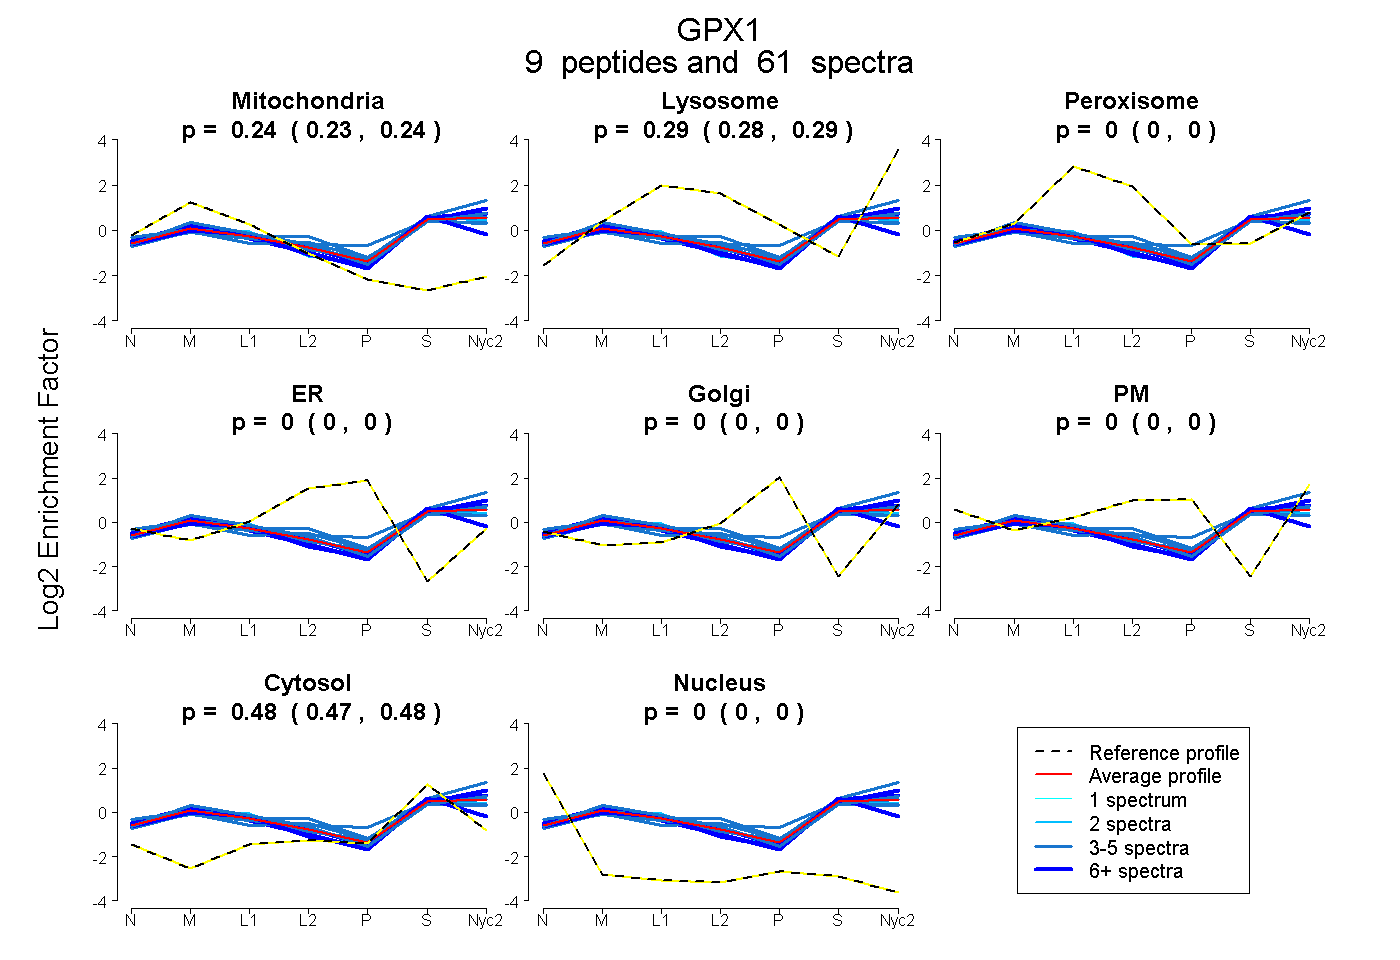
0.231 | 0.239
0.285 | 0.293
0.000 | 0.000
0.000 | 0.000
0.000 | 0.000
0.000 | 0.000
0.474 | 0.478
0.000 | 0.000
6peptides
spectra
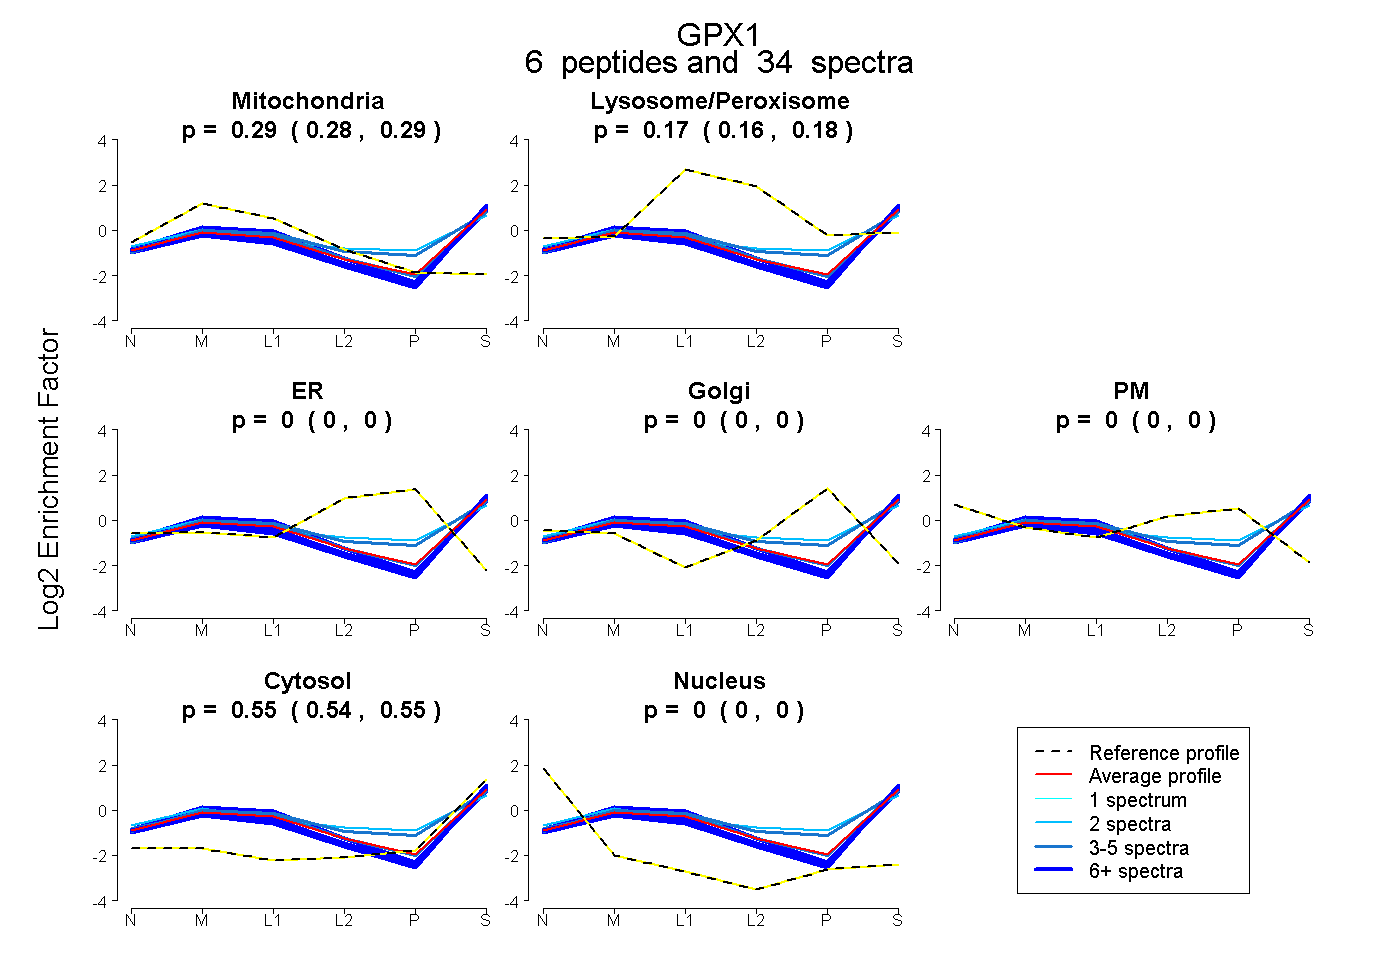
0.276 | 0.293
0.160 | 0.177
0.000 | 0.000
0.000 | 0.000
0.000 | 0.000
0.541 | 0.549
0.000 | 0.000
10peptides
spectra
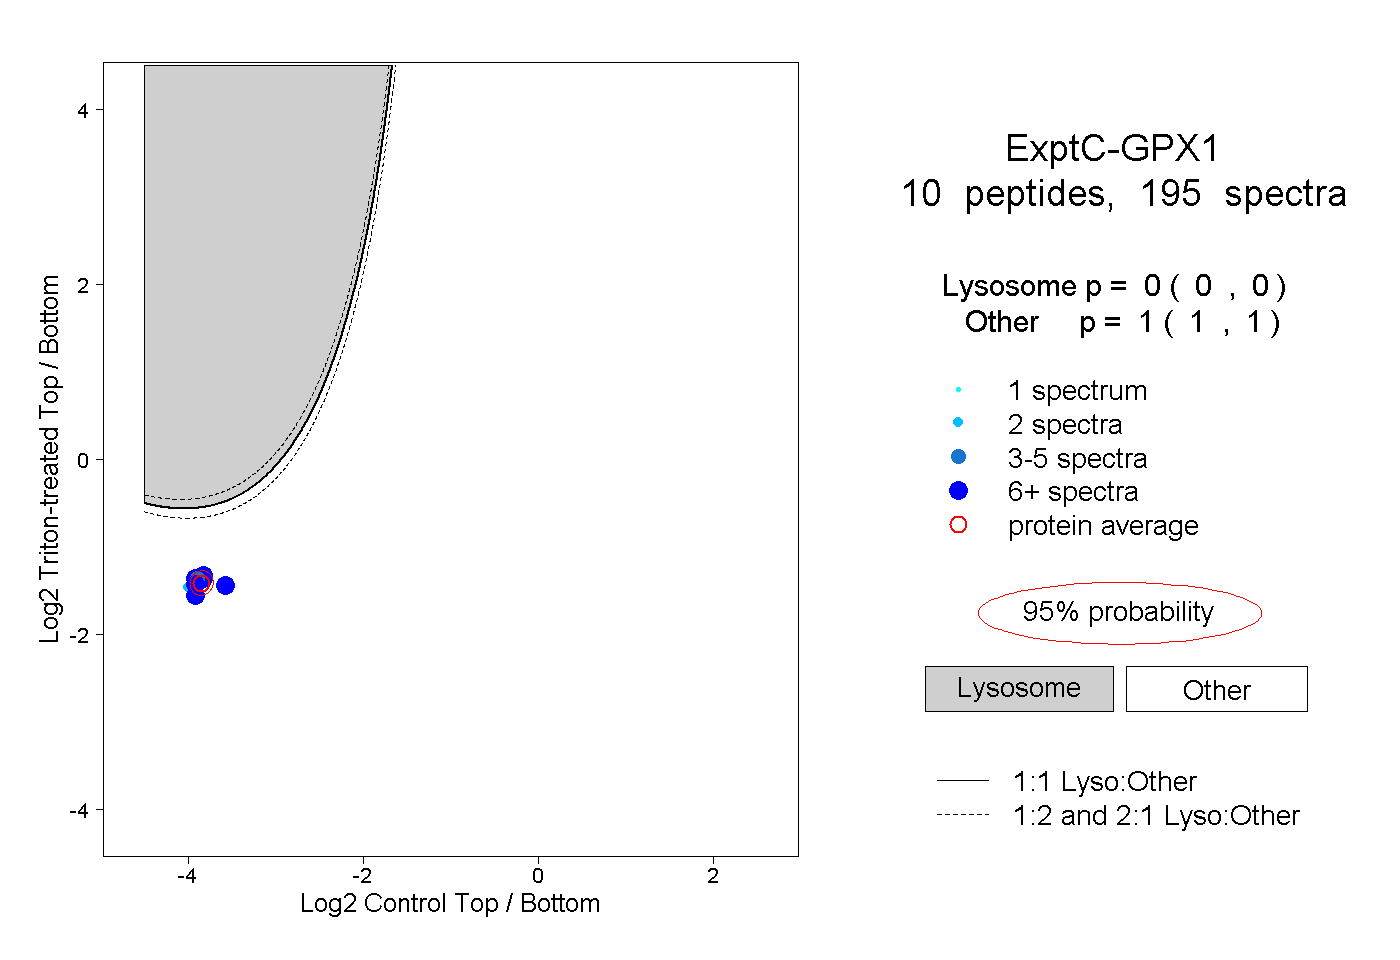
0.000 | 0.000
1.000 | 1.000
5peptides
spectra
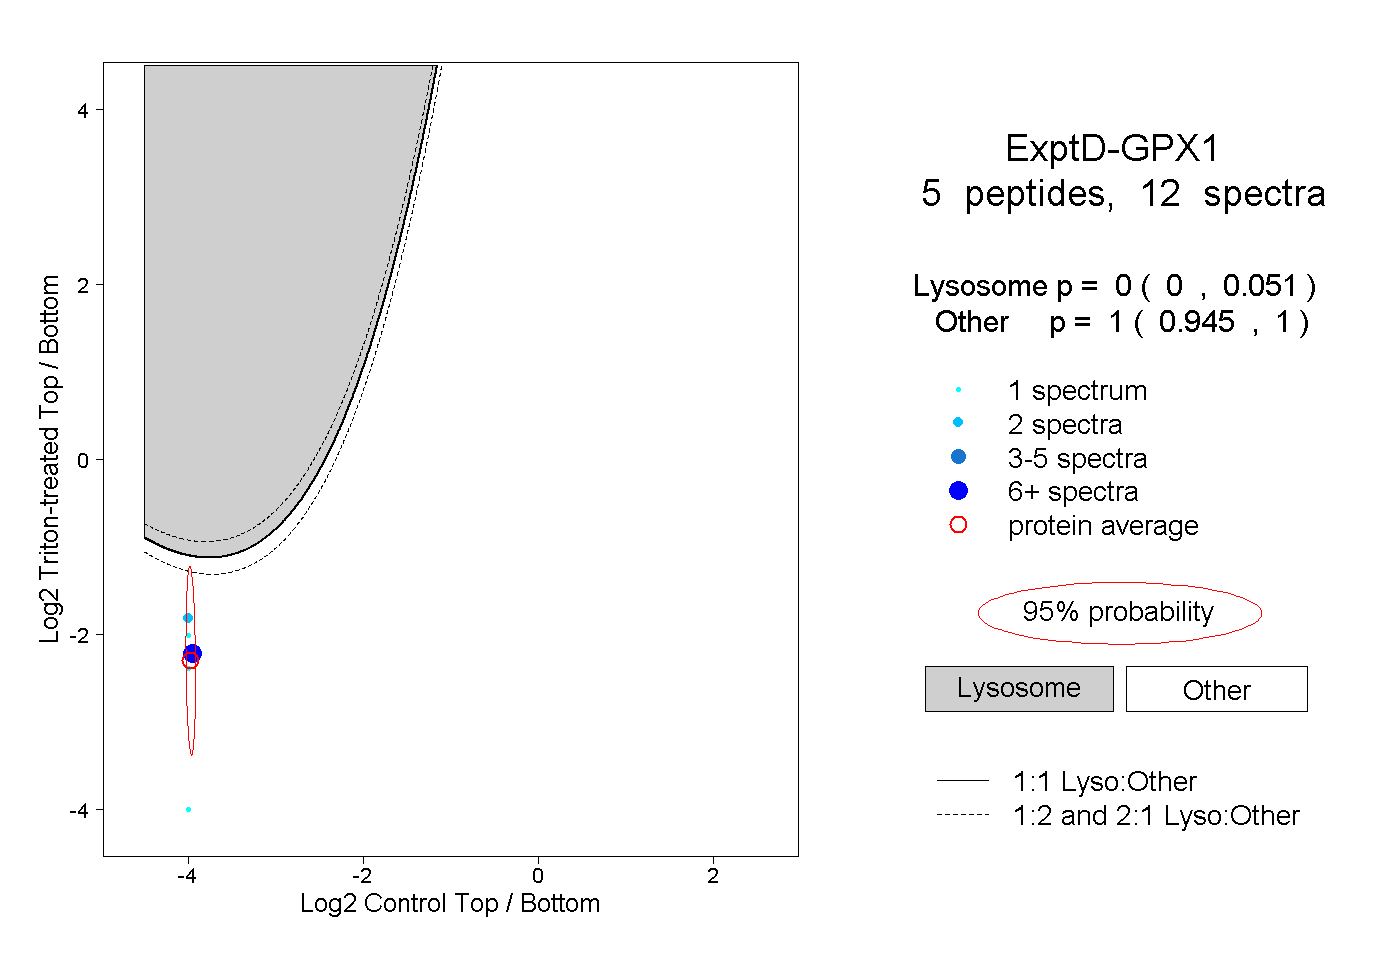
0.000 | 0.051
0.945 | 1.000