 6
6peptides
spectra
0.000 | 0.000
0.000 | 0.000
0.208 | 0.270
0.028 | 0.136
0.291 | 0.386
0.000 | 0.000
0.302 | 0.348
0.000 | 0.000
| Plot | Mito | Lyso | Perox | ER | Golgi | PM | Cytosol | Nucleus | |||||
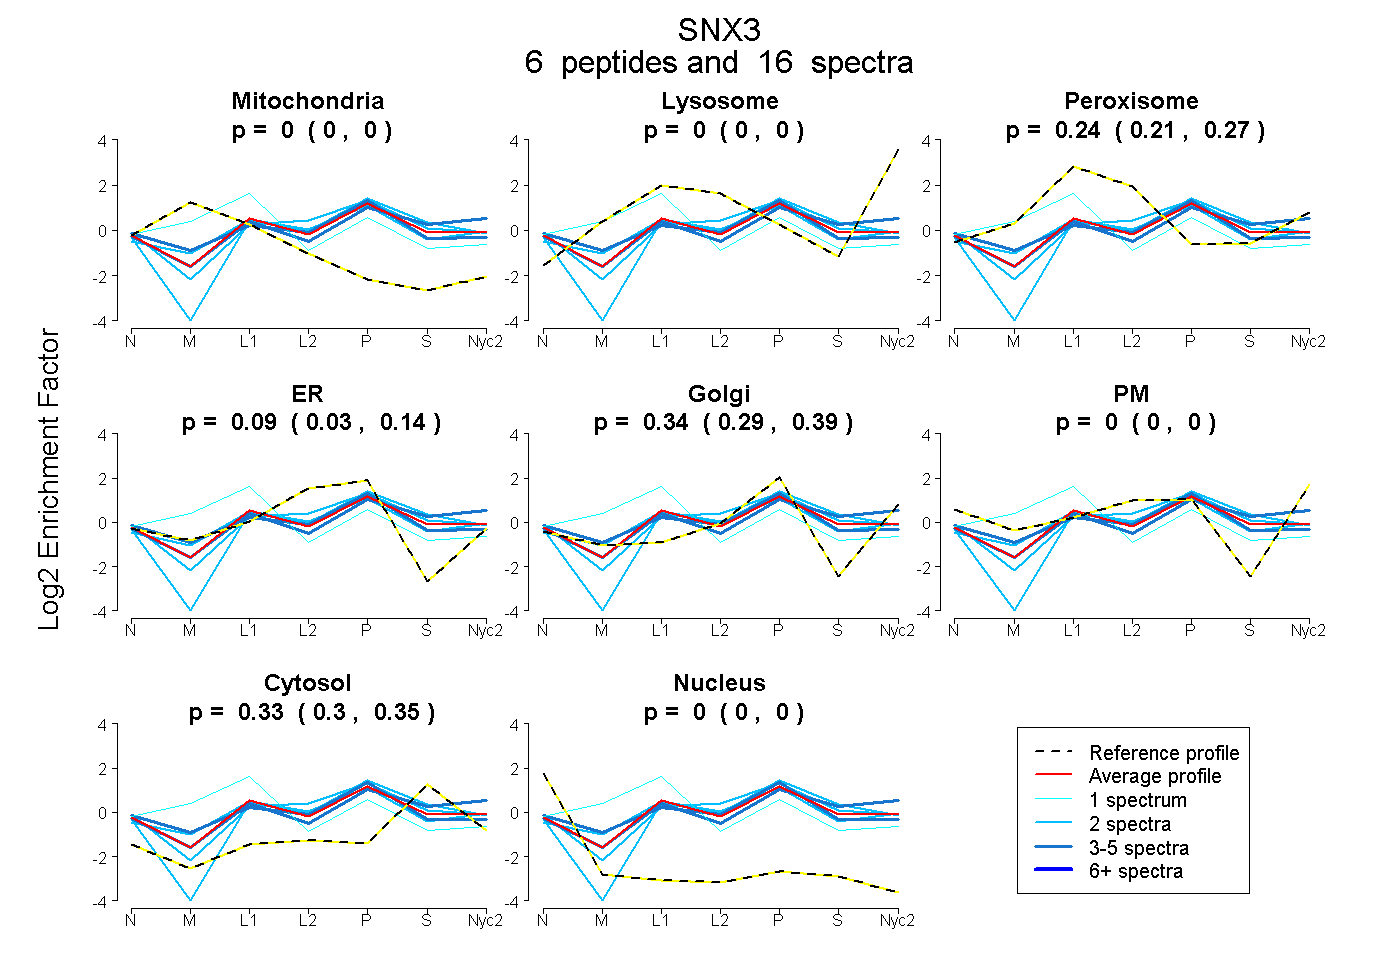
| Expt A |
6 peptides |
16 spectra |
|
0.000 0.000 | 0.000 |
0.000 0.000 | 0.000 |
0.242 0.208 | 0.270 |
0.088 0.028 | 0.136 |
0.342 0.291 | 0.386 |
0.000 0.000 | 0.000 |
0.327 0.302 | 0.348 |
0.000 0.000 | 0.000 |
| 1 spectrum, VVVPPLPGK | 0.292 | 0.000 | 0.366 | 0.000 | 0.262 | 0.000 | 0.079 | 0.000 | ||
| 5 spectra, SYTPSK | 0.000 | 0.029 | 0.222 | 0.000 | 0.384 | 0.000 | 0.366 | 0.000 | ||
| 2 spectra, GDDGIFDDNFIEER | 0.000 | 0.000 | 0.000 | 0.405 | 0.049 | 0.000 | 0.546 | 0.000 | ||
| 2 spectra, QGLEQFINK | 0.000 | 0.000 | 0.130 | 0.381 | 0.103 | 0.000 | 0.386 | 0.000 | ||
| 2 spectra, CLHMFLQDEIIDK | 0.000 | 0.000 | 0.275 | 0.113 | 0.346 | 0.000 | 0.266 | 0.000 | ||
| 4 spectra, VAGHPLAQNER | 0.000 | 0.000 | 0.197 | 0.203 | 0.319 | 0.000 | 0.281 | 0.000 |
| Plot | Mito | Lyso or Perox | ER | Golgi | PM | Cytosol | Nucleus | ||||||
| Expt B |
1 peptide |
4 spectra |
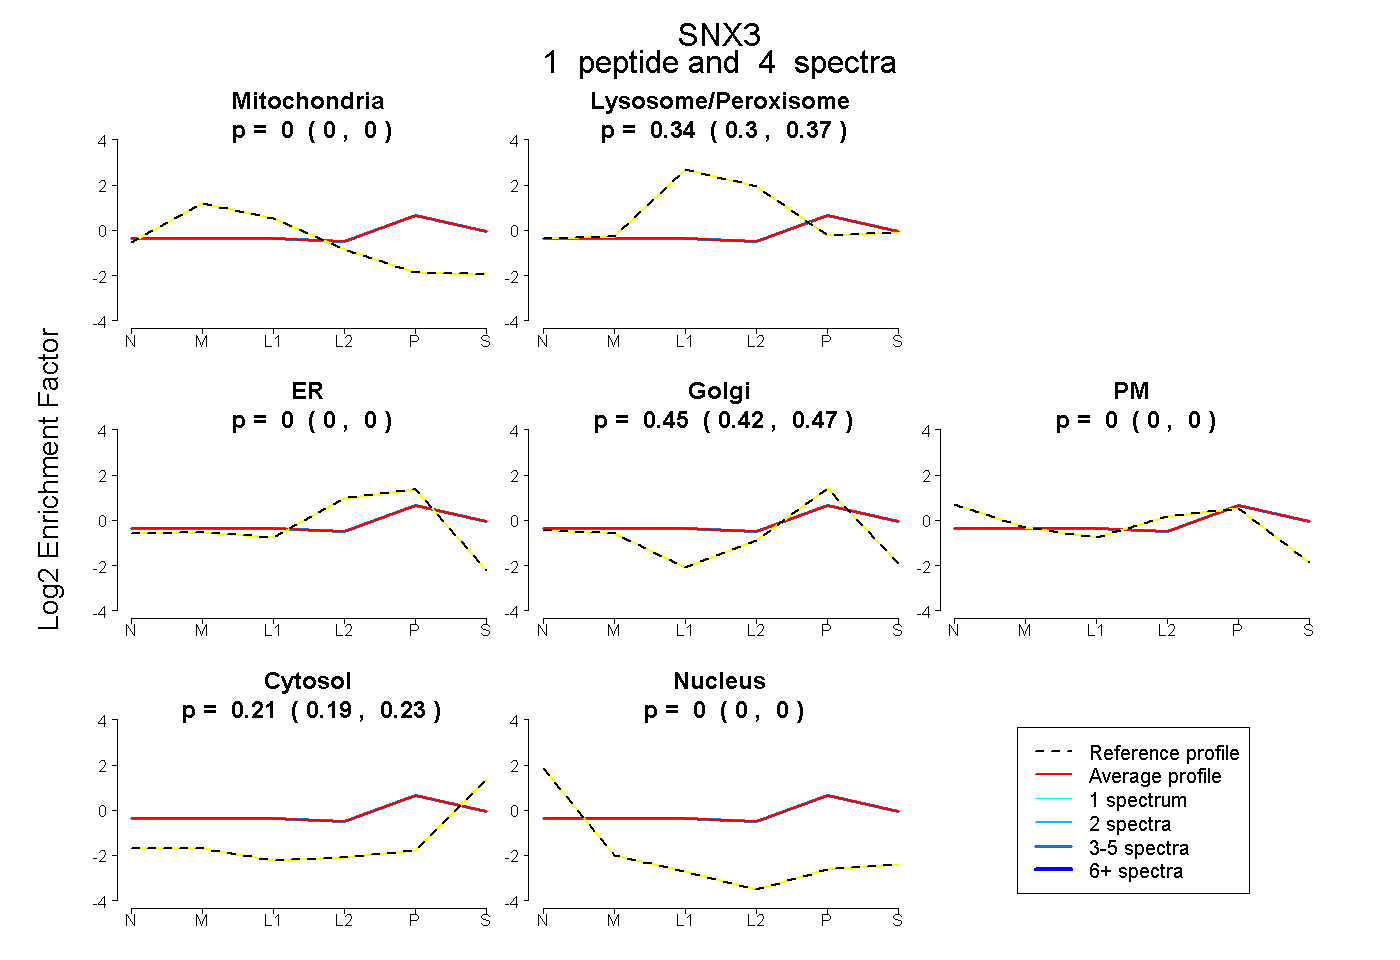 |
0.000 0.000 | 0.000 |
0.341 0.303 | 0.375 |
0.000 0.000 | 0.000 |
0.451 0.420 | 0.471 |
0.000 0.000 | 0.000 |
0.208 0.186 | 0.227 |
0.000 0.000 | 0.000 |
|||
| Plot | Lyso | Other | |||||||||||
| Expt C |
4 peptides |
35 spectra |
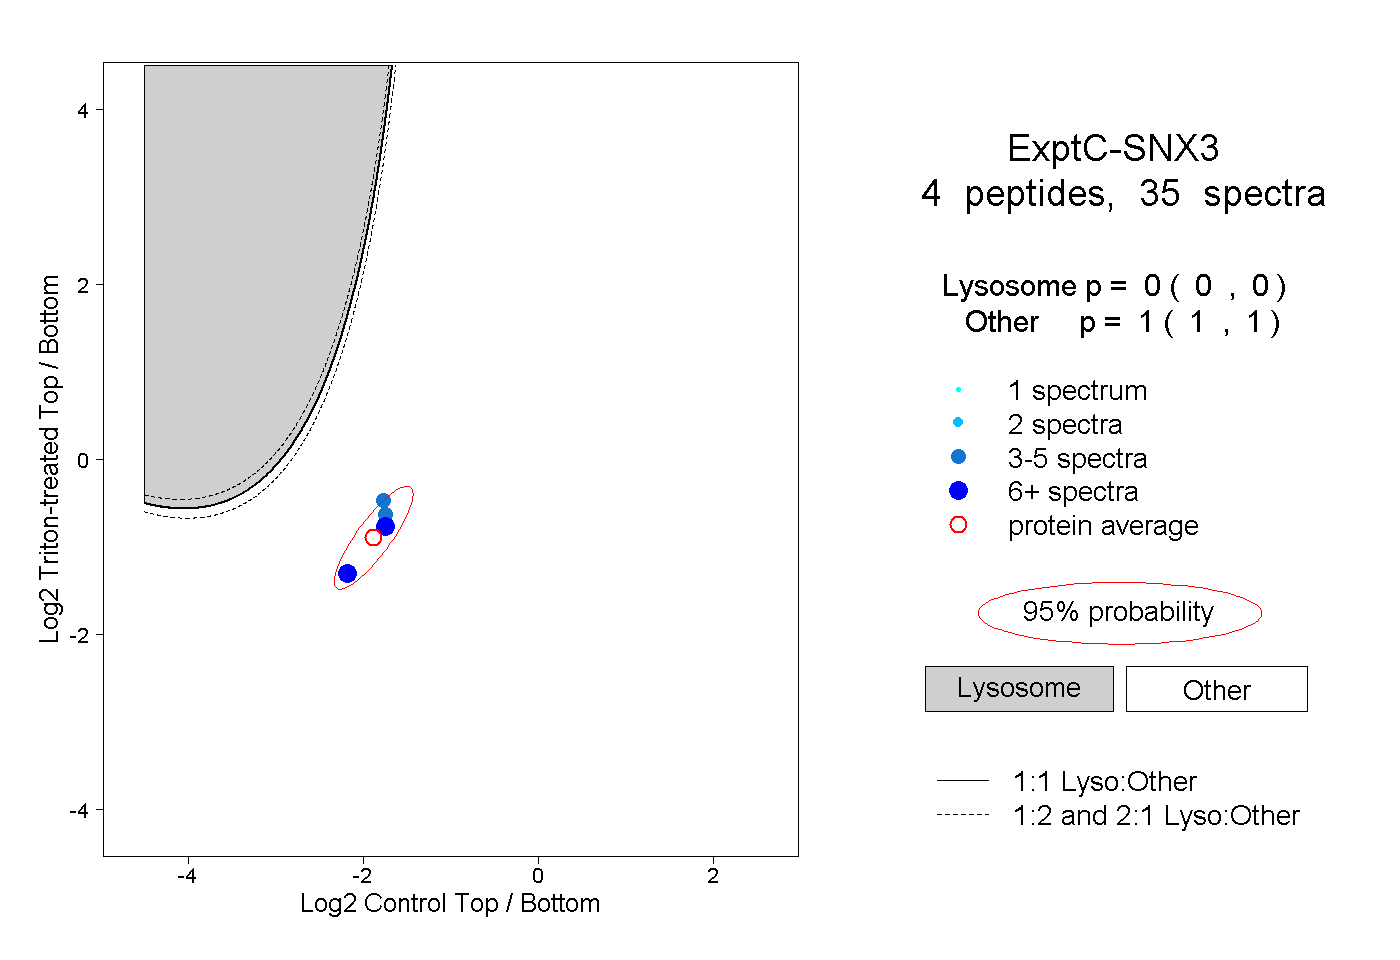 |
0.000 0.000 | 0.000 |
1.000 1.000 | 1.000 |
||||||||
| Plot | Lyso | Other | |||||||||||
| Expt D |
2 peptides |
2 spectra |
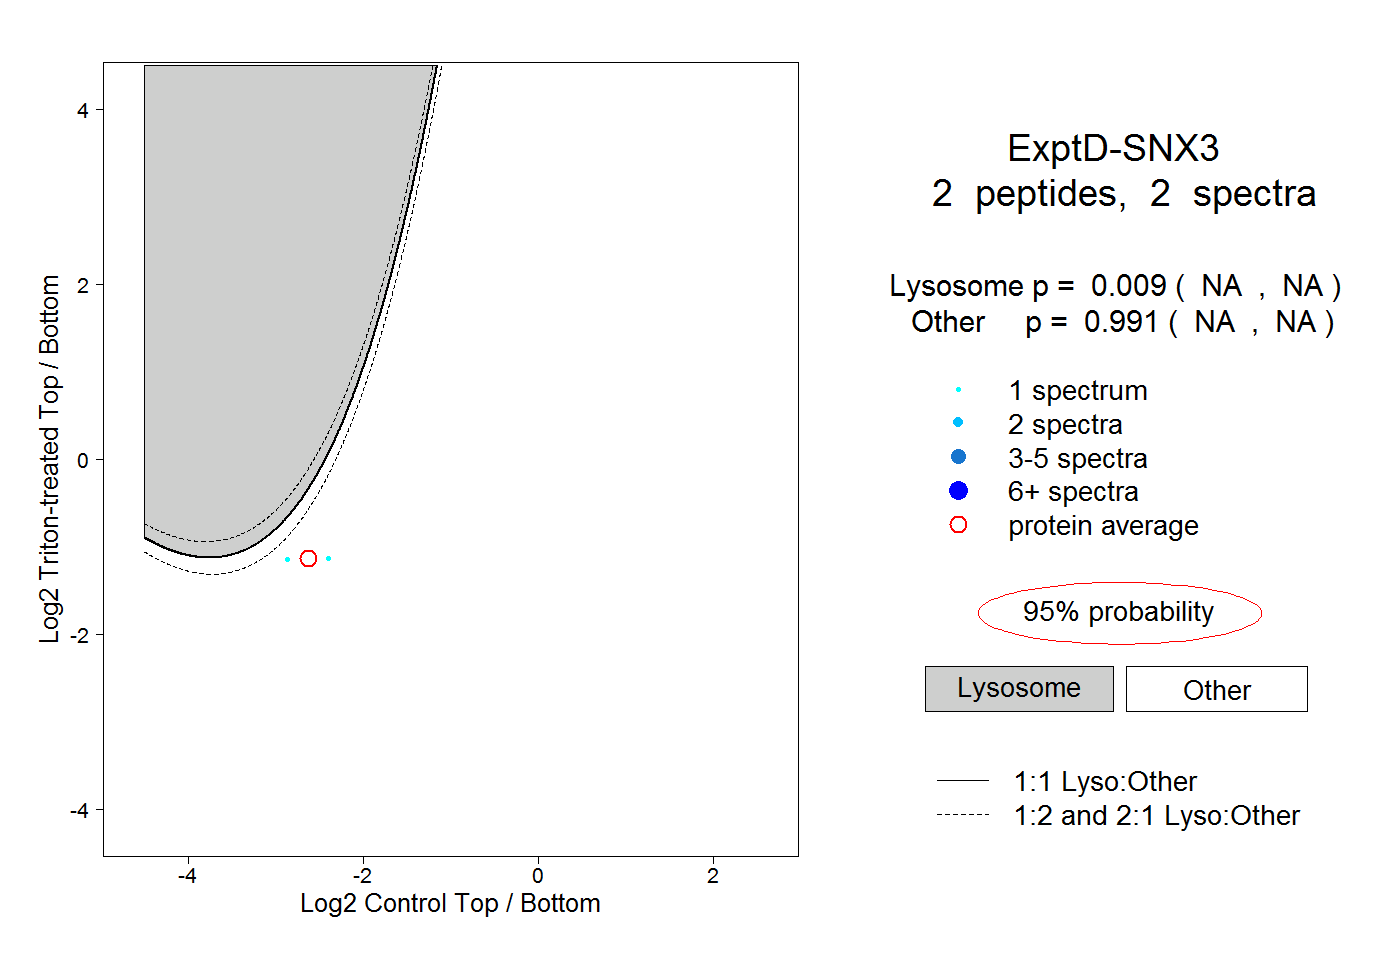 |
0.009 NA | NA |
0.991 NA | NA |