8
8peptides
spectra
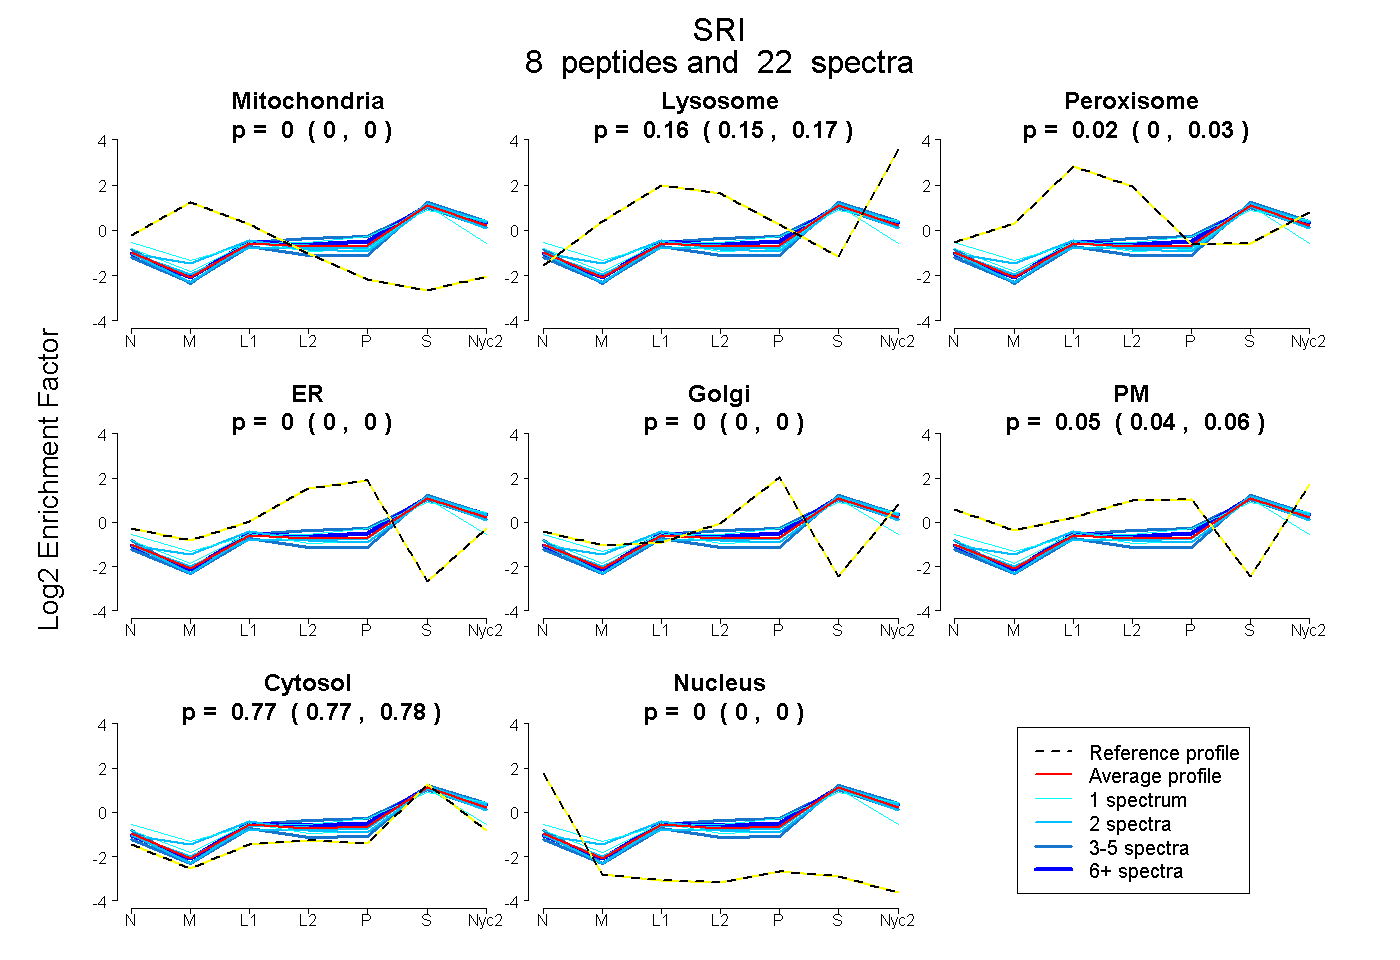
0.000 | 0.000
0.150 | 0.175
0.003 | 0.027
0.000 | 0.000
0.000 | 0.000
0.040 | 0.056
0.765 | 0.776
0.000 | 0.000
2peptides
spectra
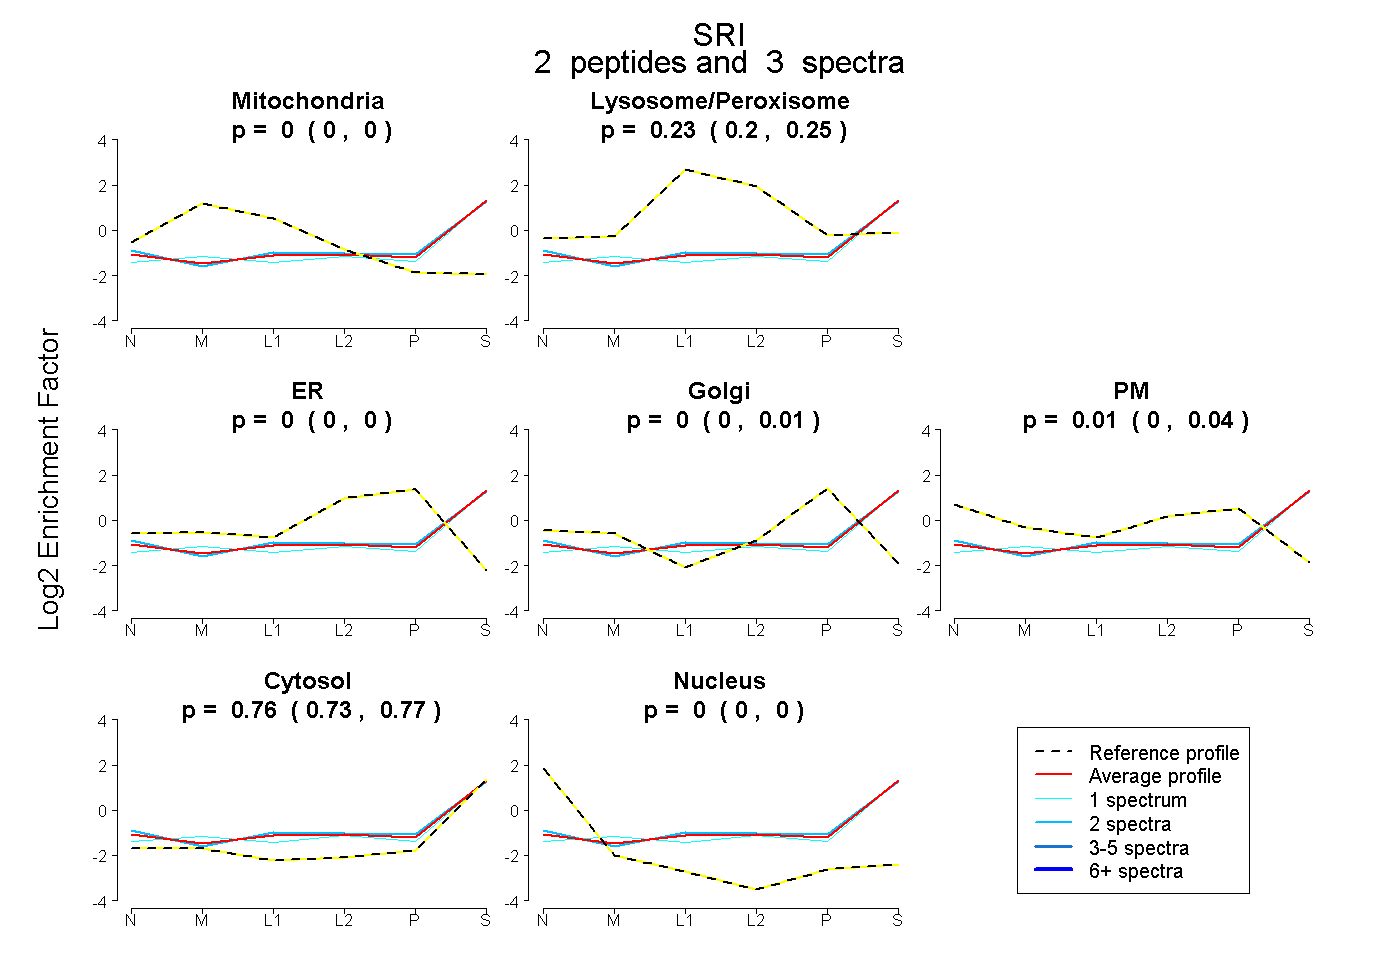
0.000 | 0.000
0.201 | 0.254
0.000 | 0.000
0.000 | 0.007
0.000 | 0.039
0.734 | 0.770
0.000 | 0.004
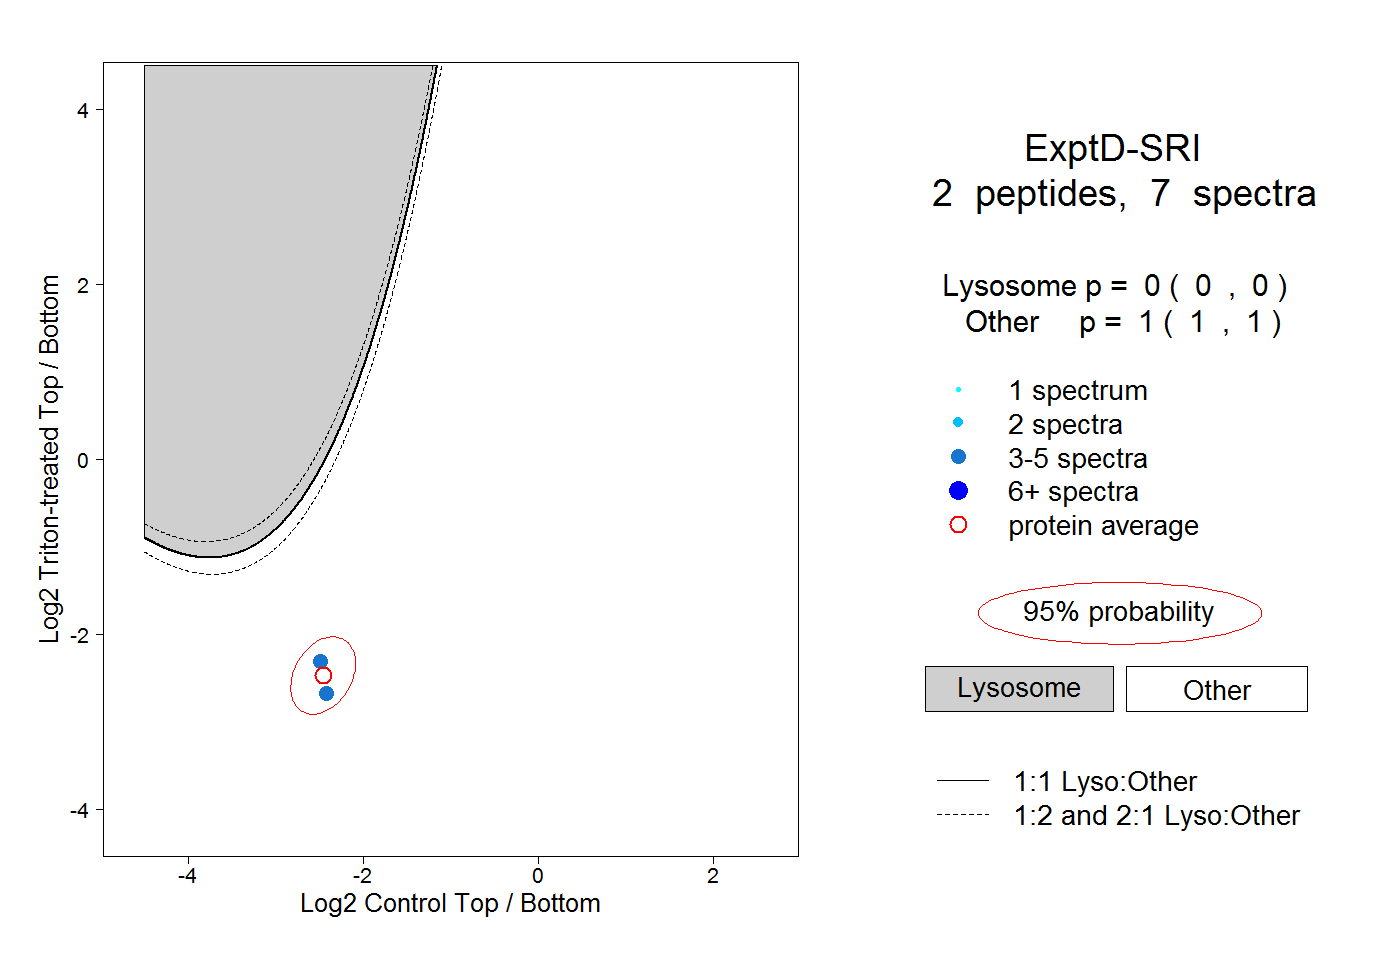
8peptides
spectra
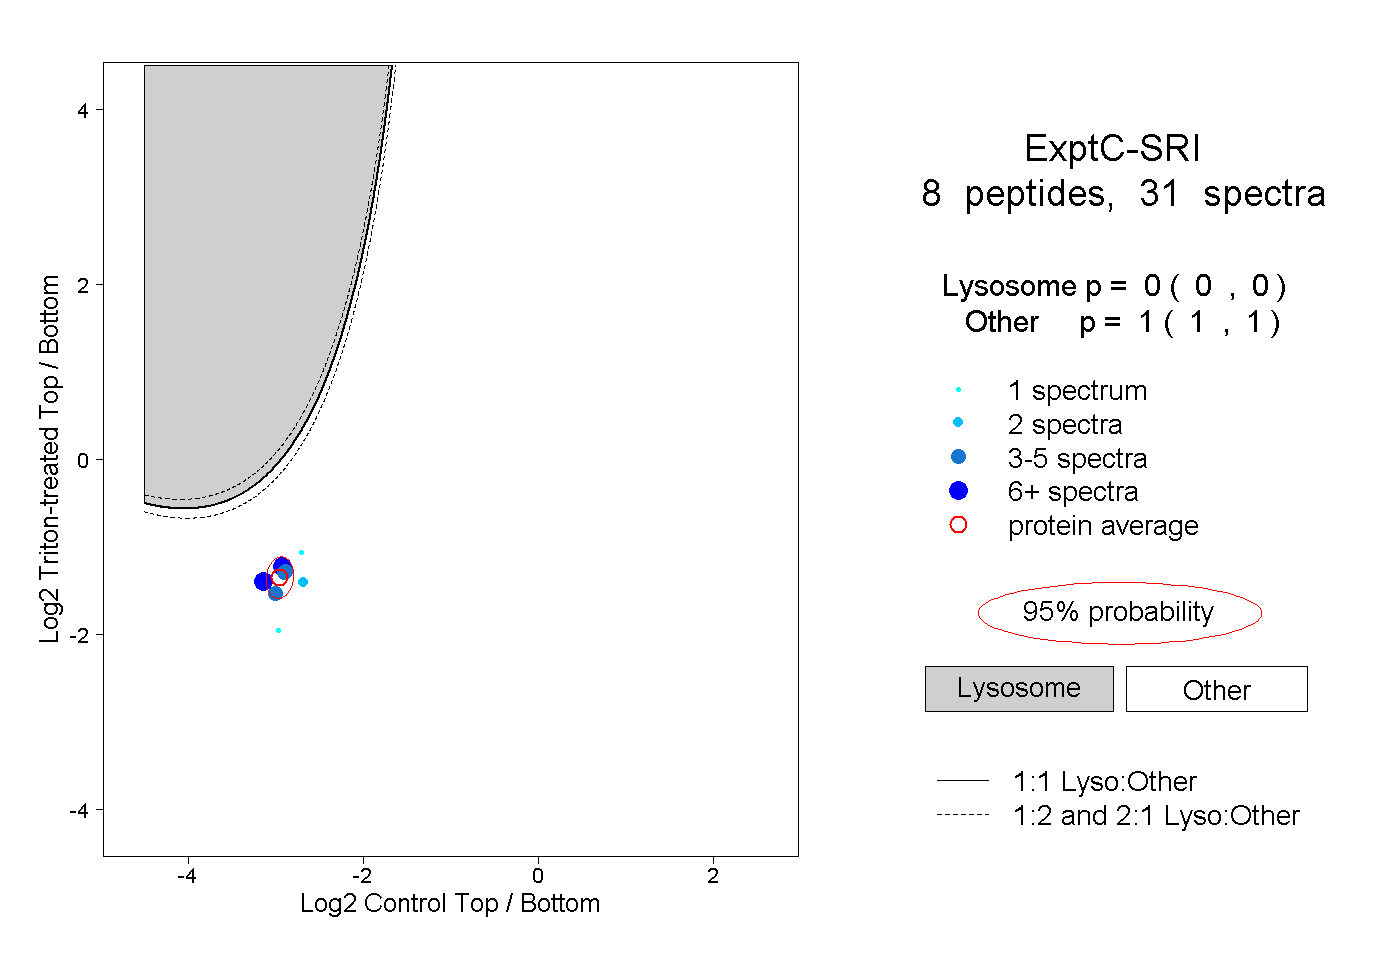
0.000 | 0.000
1.000 | 1.000