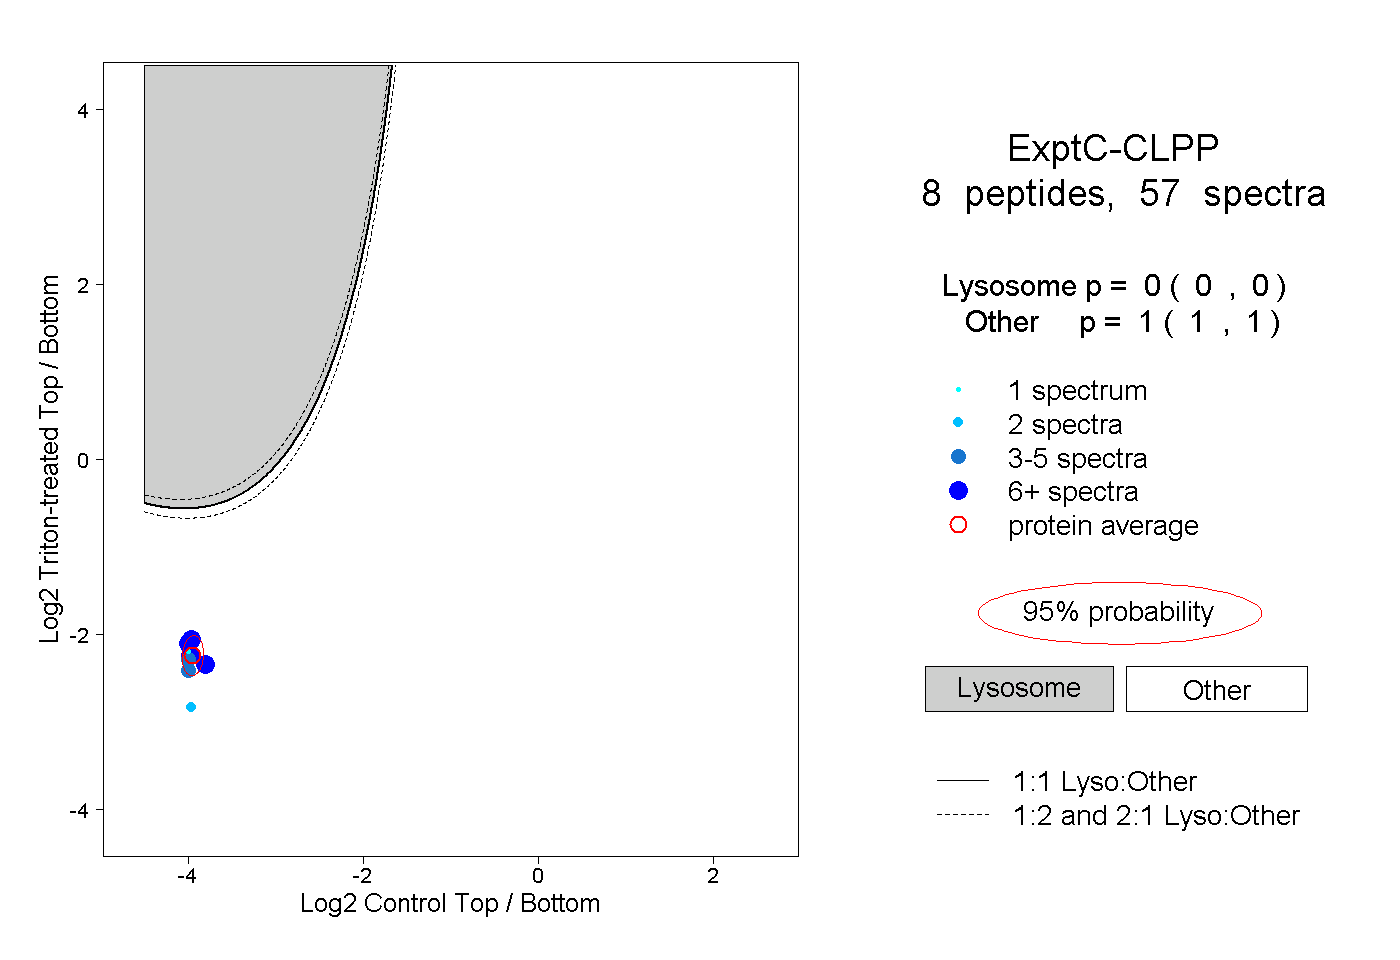
8
8peptides
spectra

0.932 | 0.973
0.000 | 0.000
0.013 | 0.046
0.000 | 0.000
0.000 | 0.000
0.000 | 0.000
0.000 | 0.000
0.008 | 0.021
4peptides
spectra

0.655 | 0.798
0.088 | 0.179
0.000 | 0.000
0.000 | 0.061
0.000 | 0.074
0.040 | 0.137
0.000 | 0.004
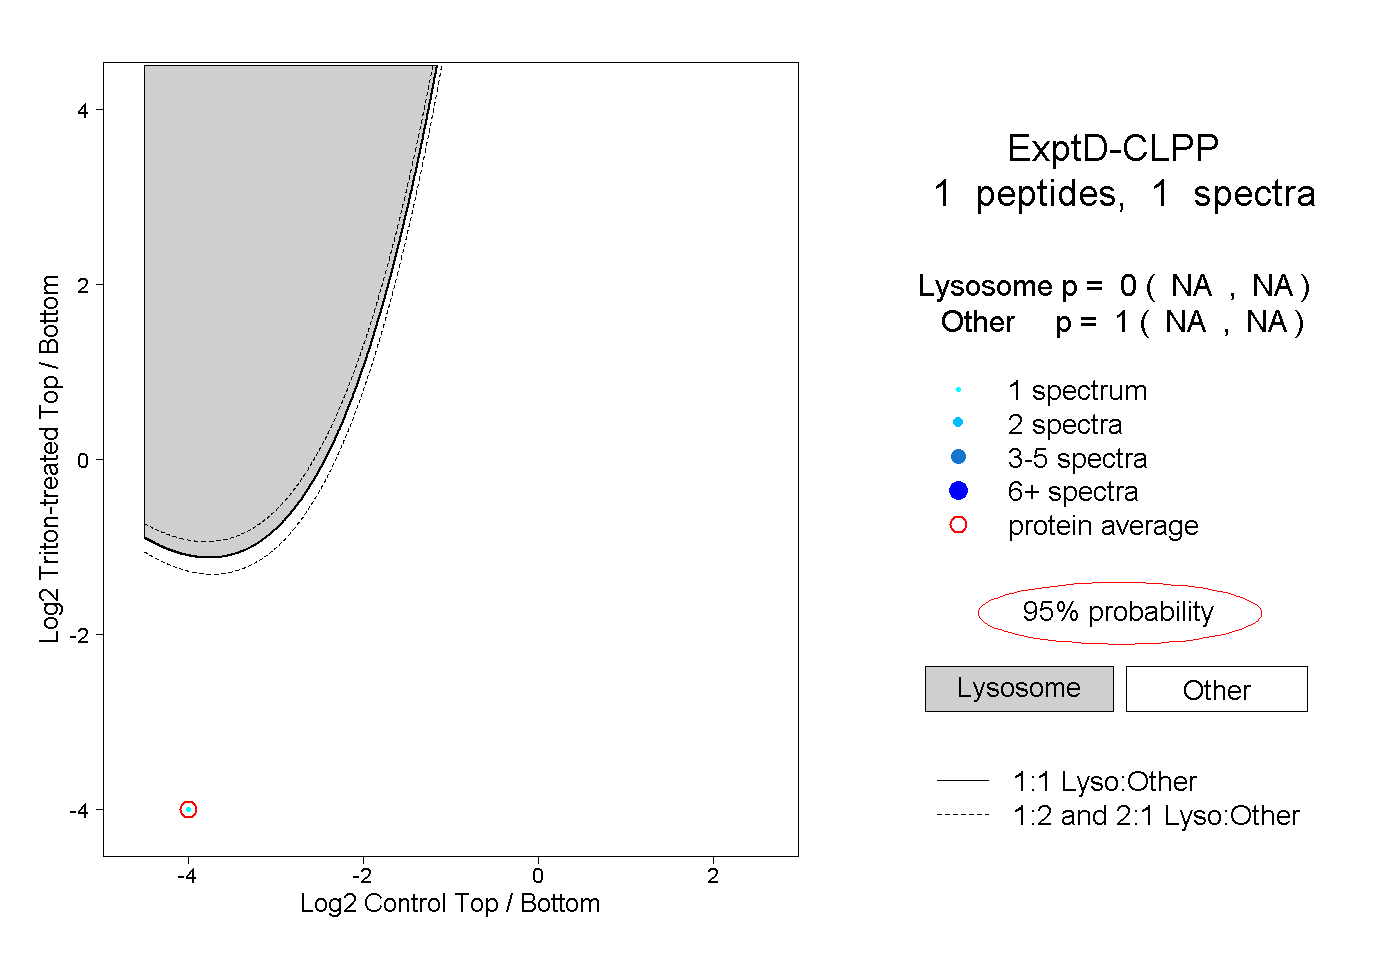
8peptides
spectra
0.000 | 0.000
1.000 | 1.000