 5
5peptides
spectra
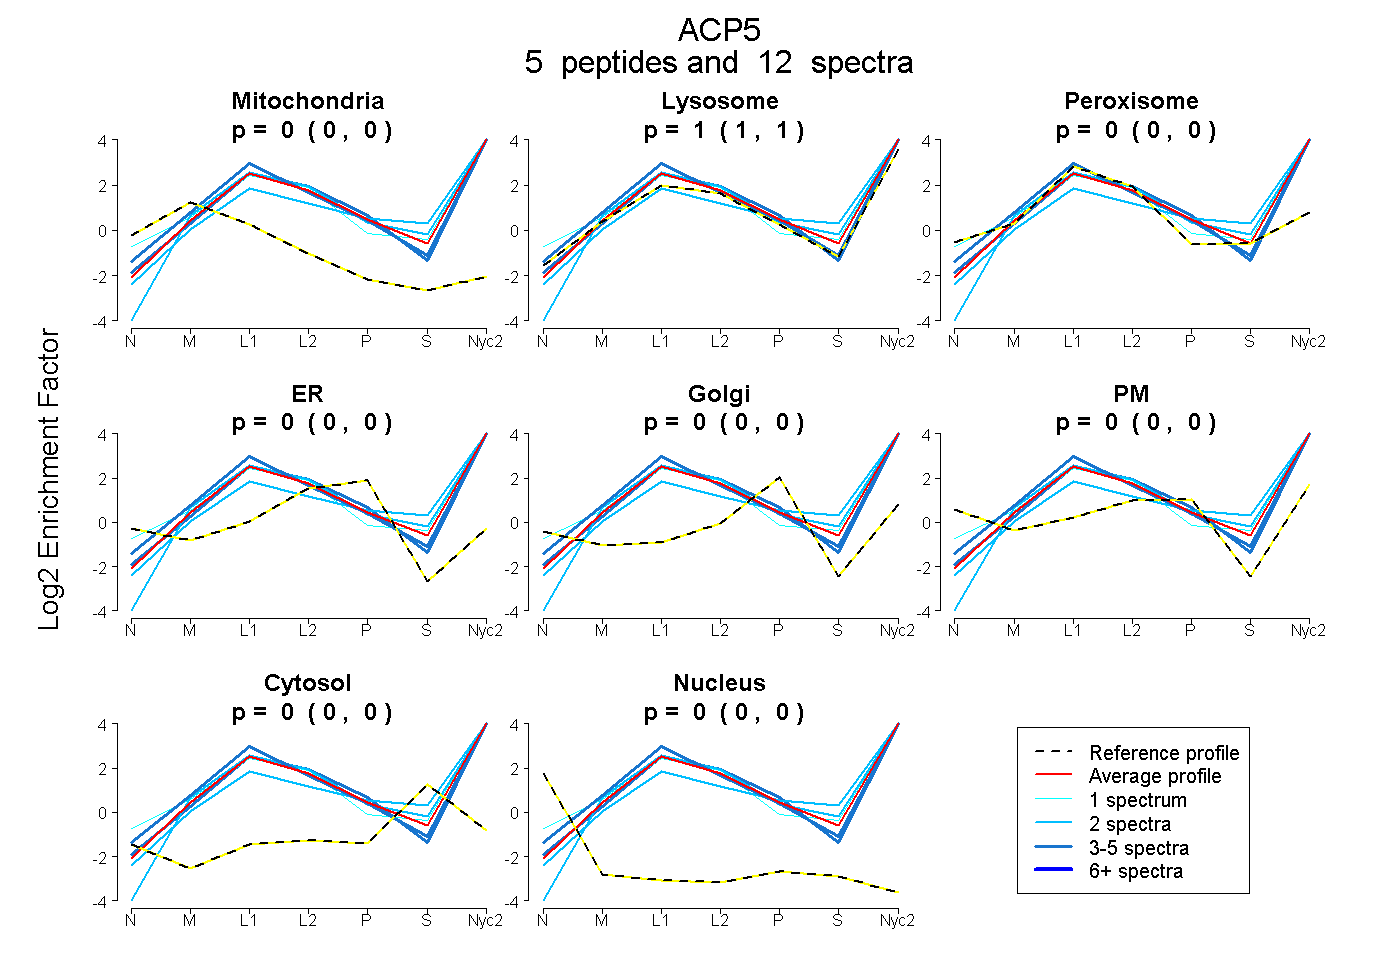
0.000 | 0.000
1.000 | 1.000
0.000 | 0.000
0.000 | 0.000
0.000 | 0.000
0.000 | 0.000
0.000 | 0.000
0.000 | 0.000
3peptides
spectra
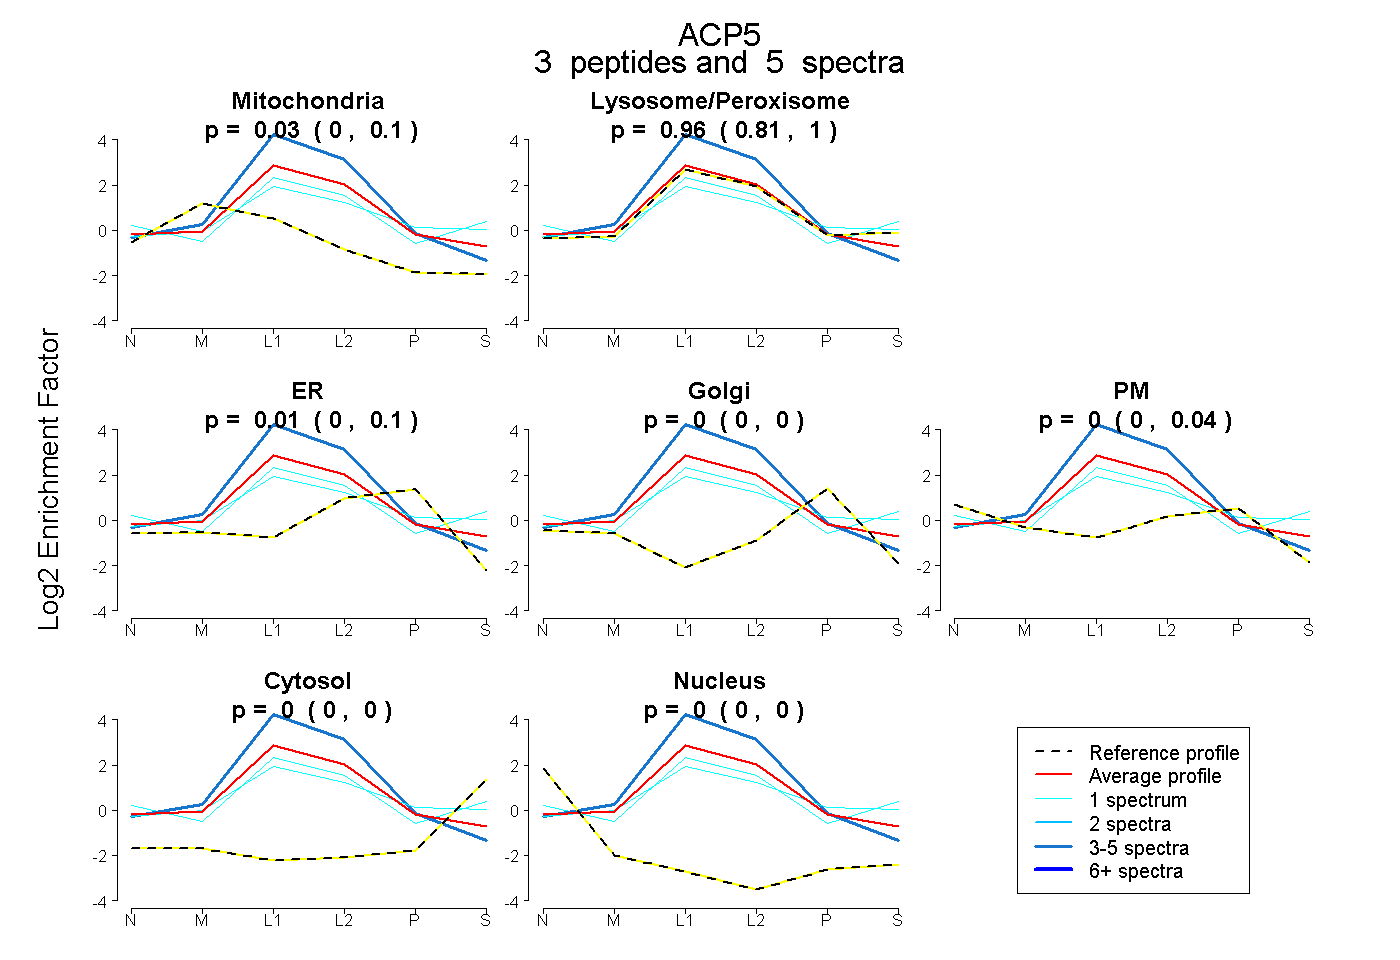
0.000 | 0.103
0.807 | 1.000
0.000 | 0.105
0.000 | 0.000
0.000 | 0.036
0.000 | 0.000
0.000 | 0.000
9peptides
spectra
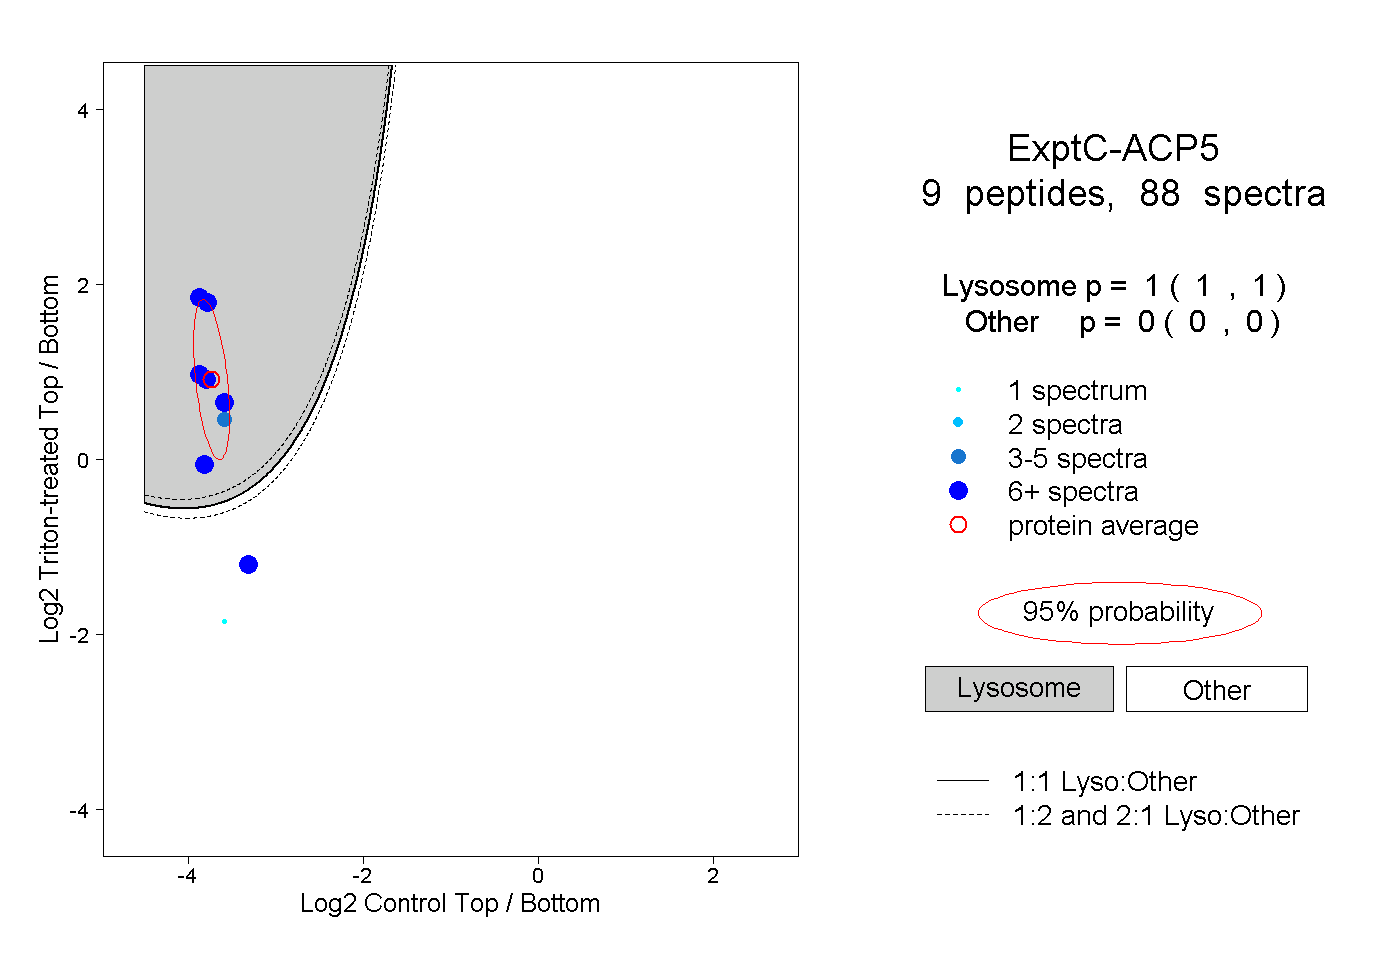
1.000 | 1.000
0.000 | 0.000
2peptides
spectra
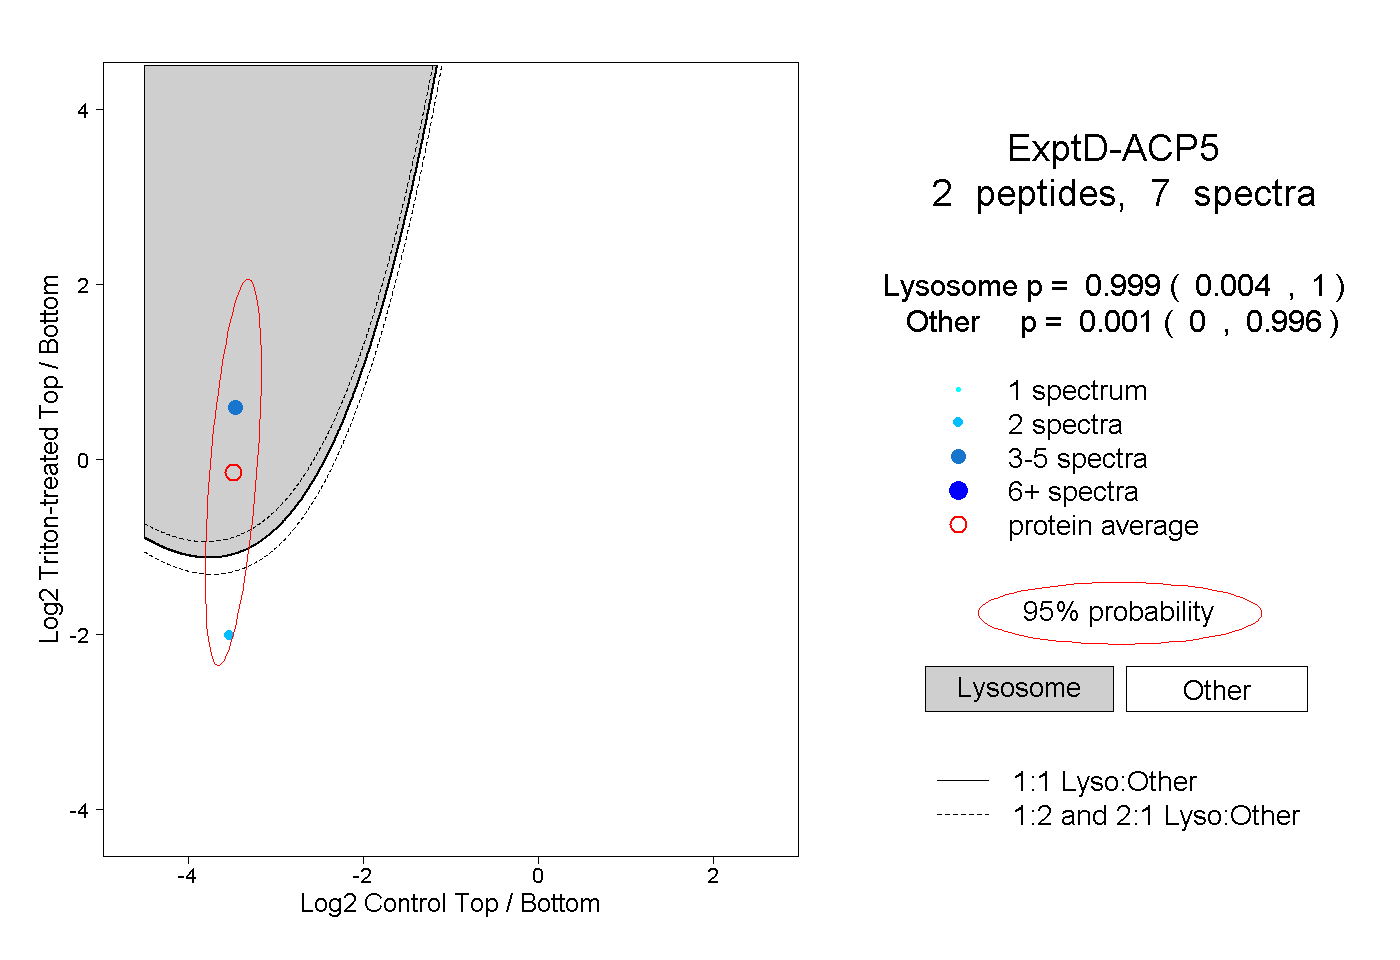
0.004 | 1.000
0.000 | 0.996