 1
1peptide
spectra
NA | NA
NA | NA
NA | NA
NA | NA
NA | NA
NA | NA
NA | NA
NA | NA
3peptides
spectra
0.845 | 0.999
0.000 | 0.153
| Plot | Mito | Lyso | Perox | ER | Golgi | PM | Cytosol | Nucleus | |||||
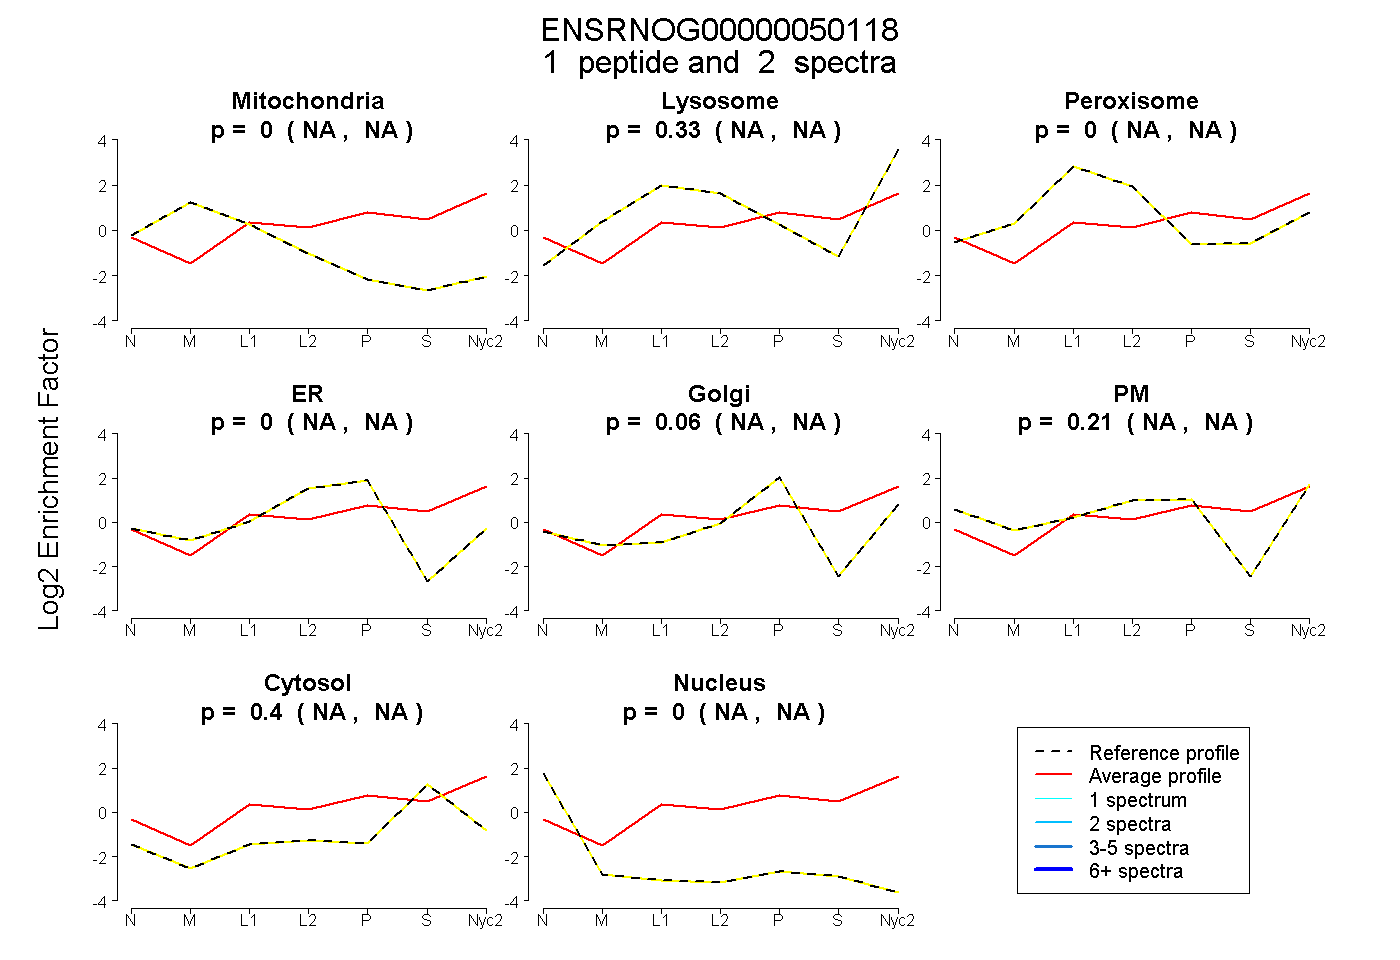
| Expt A |
1 peptide |
2 spectra |
|
0.000 NA | NA |
0.328 NA | NA |
0.000 NA | NA |
0.000 NA | NA |
0.061 NA | NA |
0.211 NA | NA |
0.400 NA | NA |
0.000 NA | NA |
||
| Plot | Lyso | Other | |||||||||||
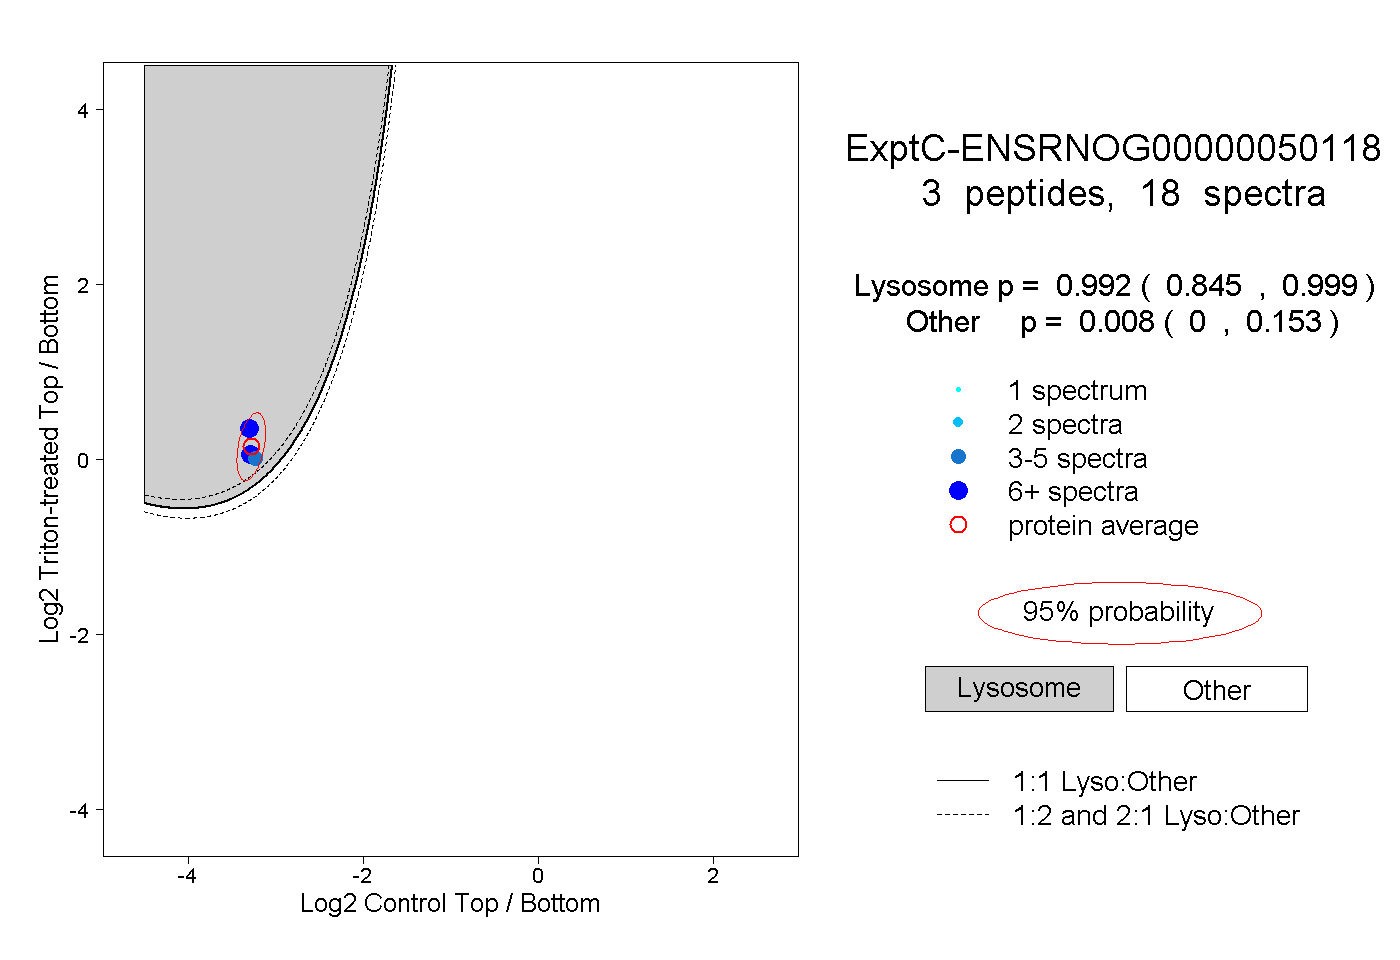
| Expt C |
3 peptides |
18 spectra |
|
0.992 0.845 | 0.999 |
0.008 0.000 | 0.153 |
| 6 spectra, SEDTATYYCTR | 0.999 | 0.001 | ||||||||
| 8 spectra, STLYLQMDSLR | 0.983 | 0.017 | ||||||||
| 4 spectra, STLYLQMNSLR | 0.953 | 0.047 |