 2
2peptides
spectra
0.000 | 0.000
0.000 | 0.061
0.000 | 0.100
0.000 | 0.308
0.000 | 0.112
0.568 | 0.883
0.000 | 0.081
0.000 | 0.026
2peptides
spectra
0.000 | 0.000
1.000 | 1.000
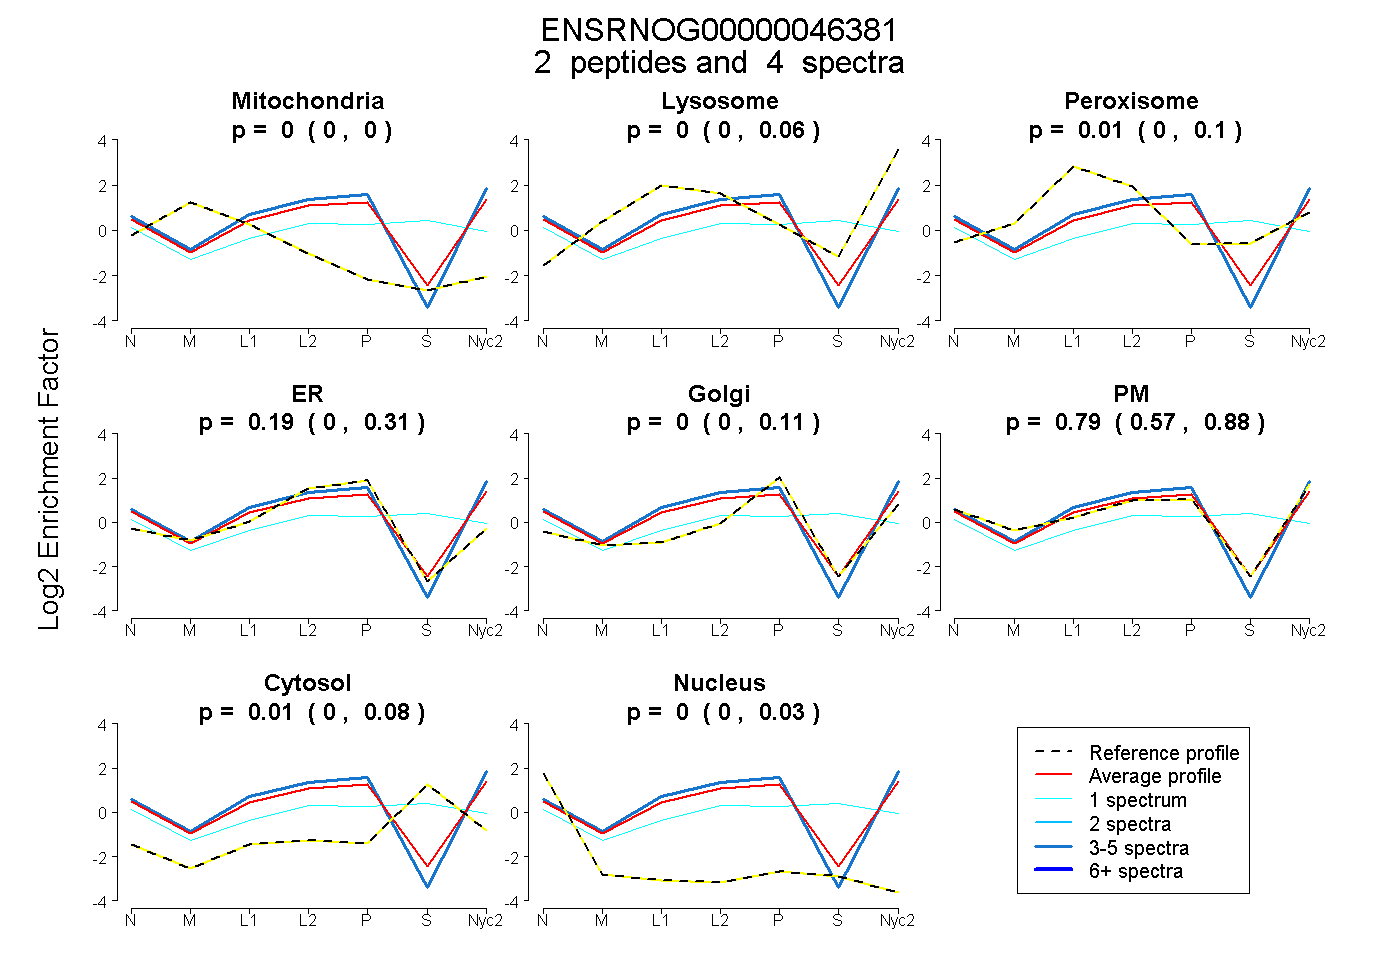
| Plot | Mito | Lyso | Perox | ER | Golgi | PM | Cytosol | Nucleus | |||||
| Expt A |
2 peptides |
4 spectra |
|
0.000 0.000 | 0.000 |
0.000 0.000 | 0.061 |
0.012 0.000 | 0.100 |
0.190 0.000 | 0.308 |
0.000 0.000 | 0.112 |
0.789 0.568 | 0.883 |
0.009 0.000 | 0.081 |
0.000 0.000 | 0.026 |
||
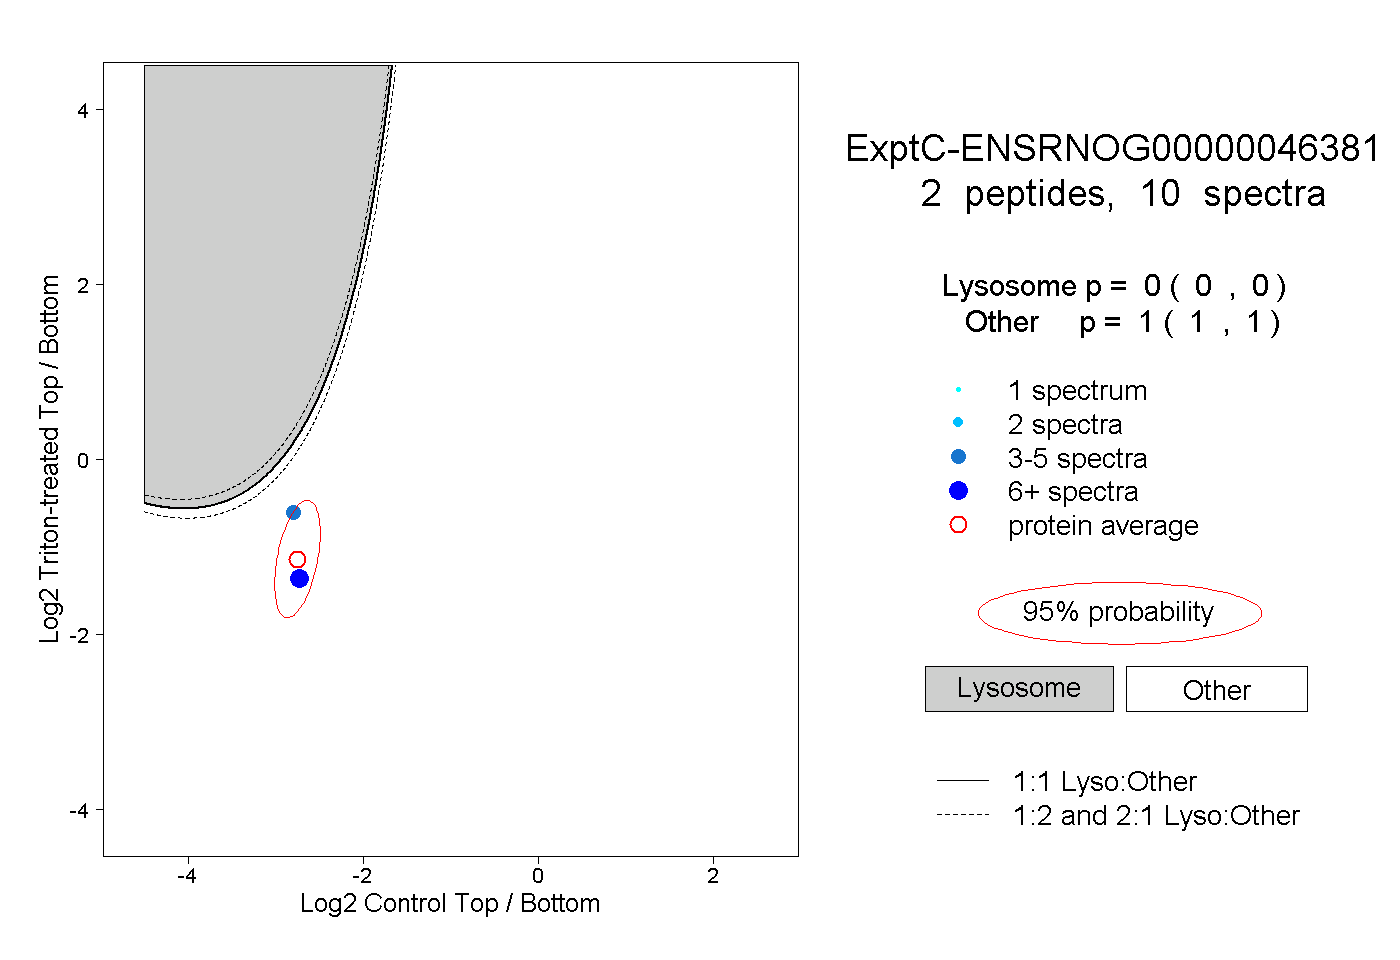
| Plot | Lyso | Other | |||||||||||
| Expt C |
2 peptides |
10 spectra |
|
0.000 0.000 | 0.000 |
1.000 1.000 | 1.000 |