 3
3peptides
spectra
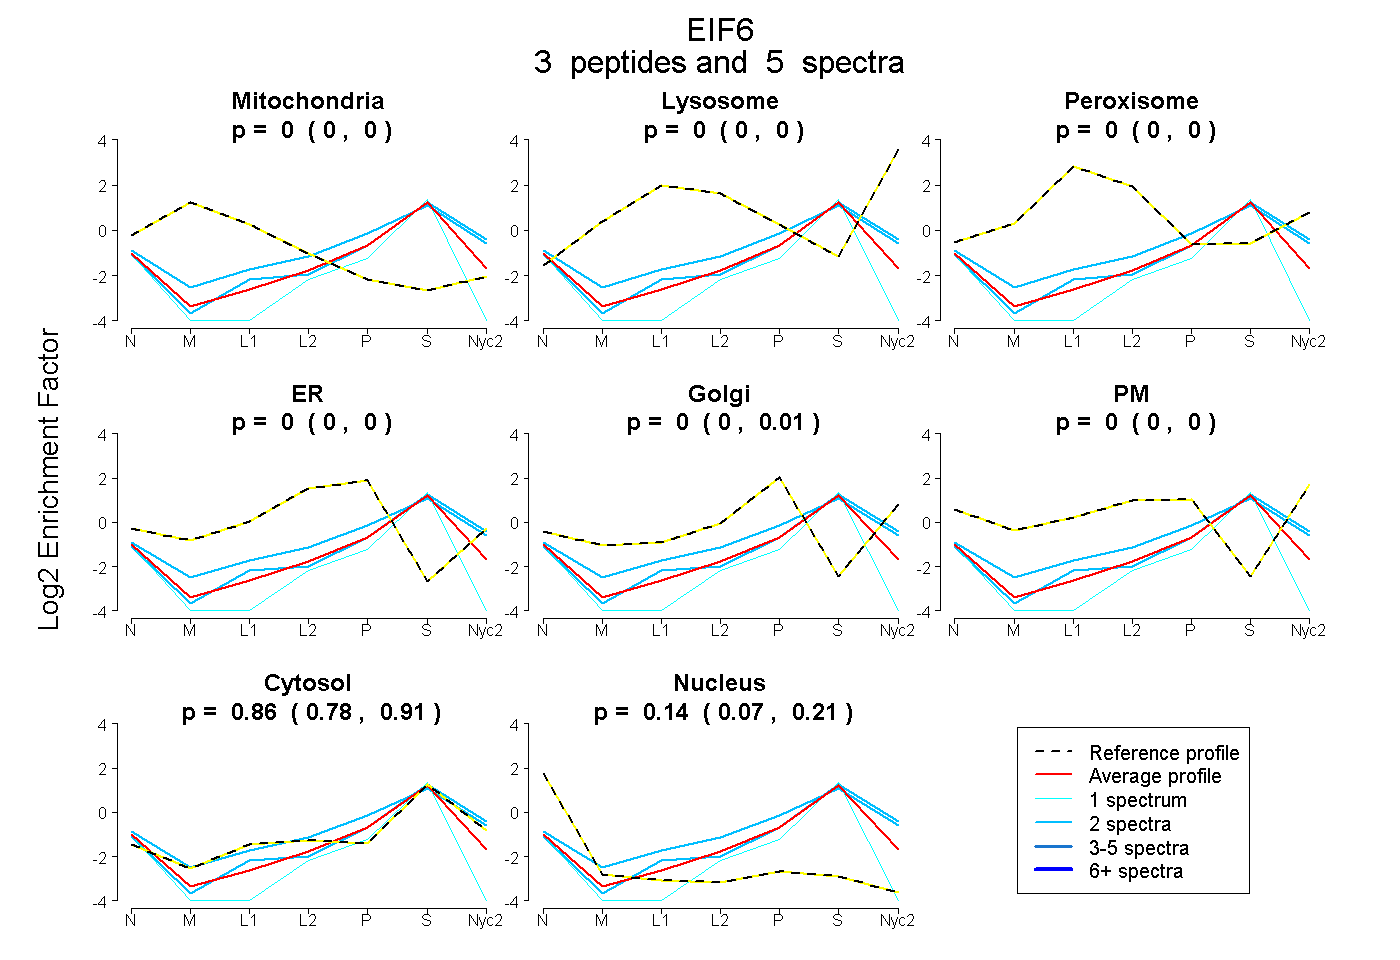
0.000 | 0.000
0.000 | 0.000
0.000 | 0.000
0.000 | 0.000
0.000 | 0.007
0.000 | 0.000
0.784 | 0.913
0.067 | 0.205
3peptides
spectra
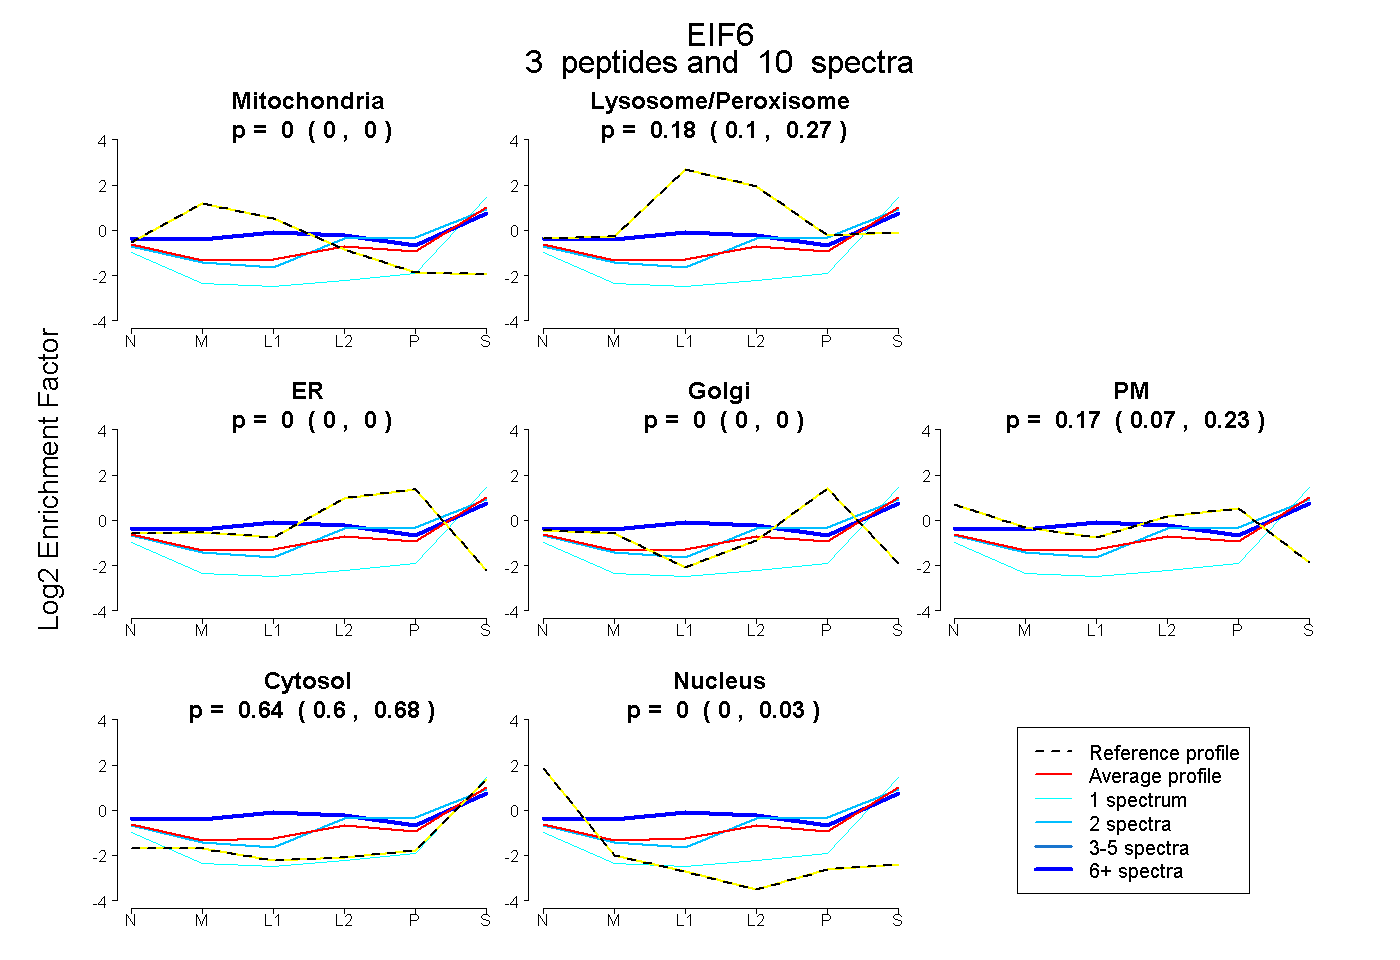
0.000 | 0.000
0.103 | 0.266
0.000 | 0.000
0.000 | 0.000
0.069 | 0.227
0.596 | 0.680
0.000 | 0.029
5peptides
spectra
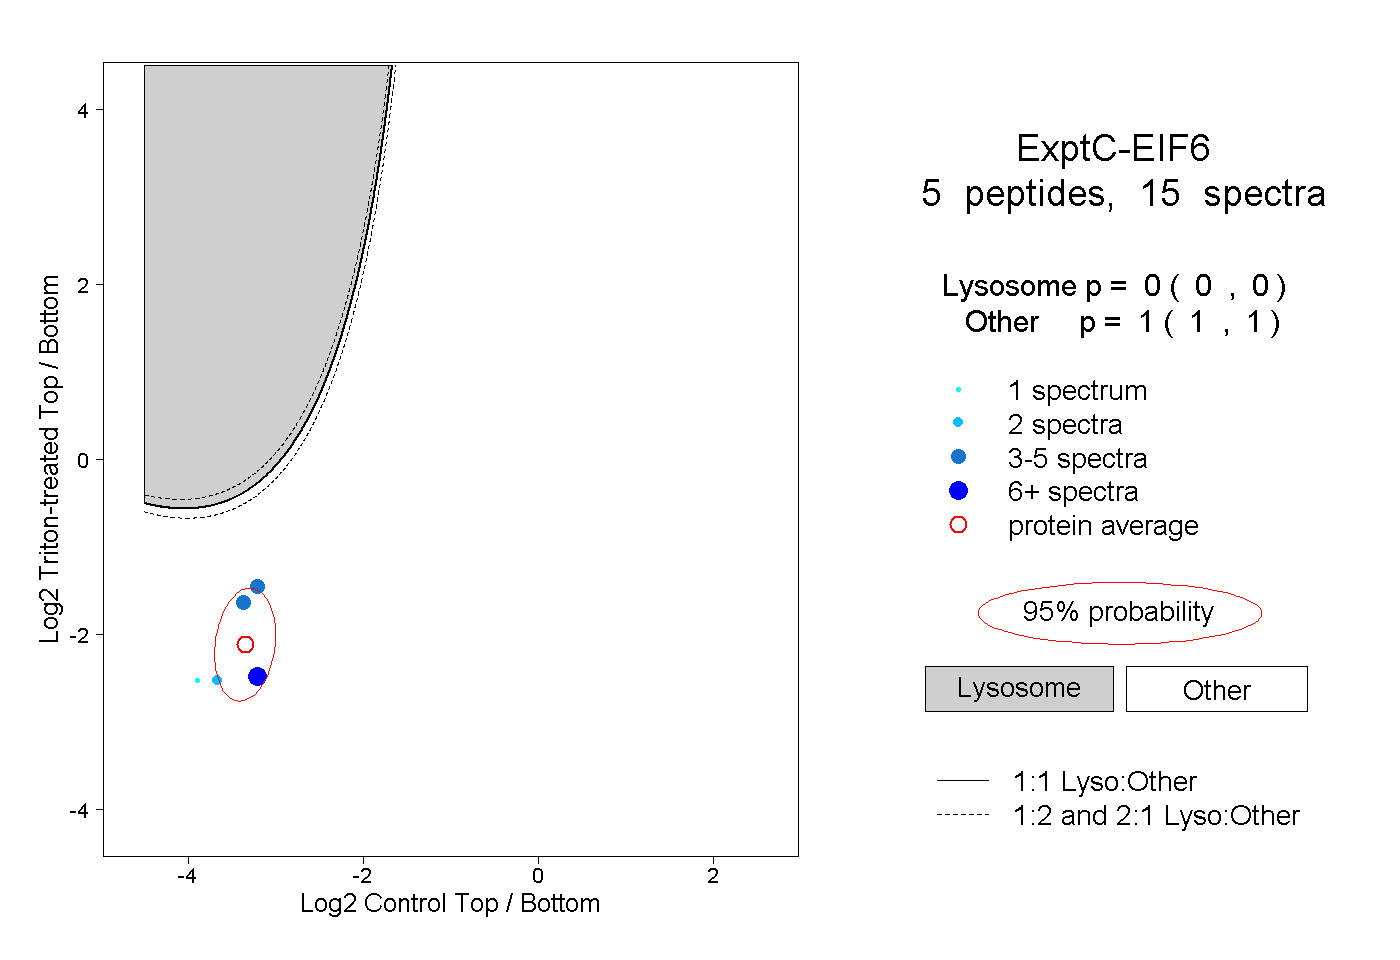
0.000 | 0.000
1.000 | 1.000
1peptide
spectrum
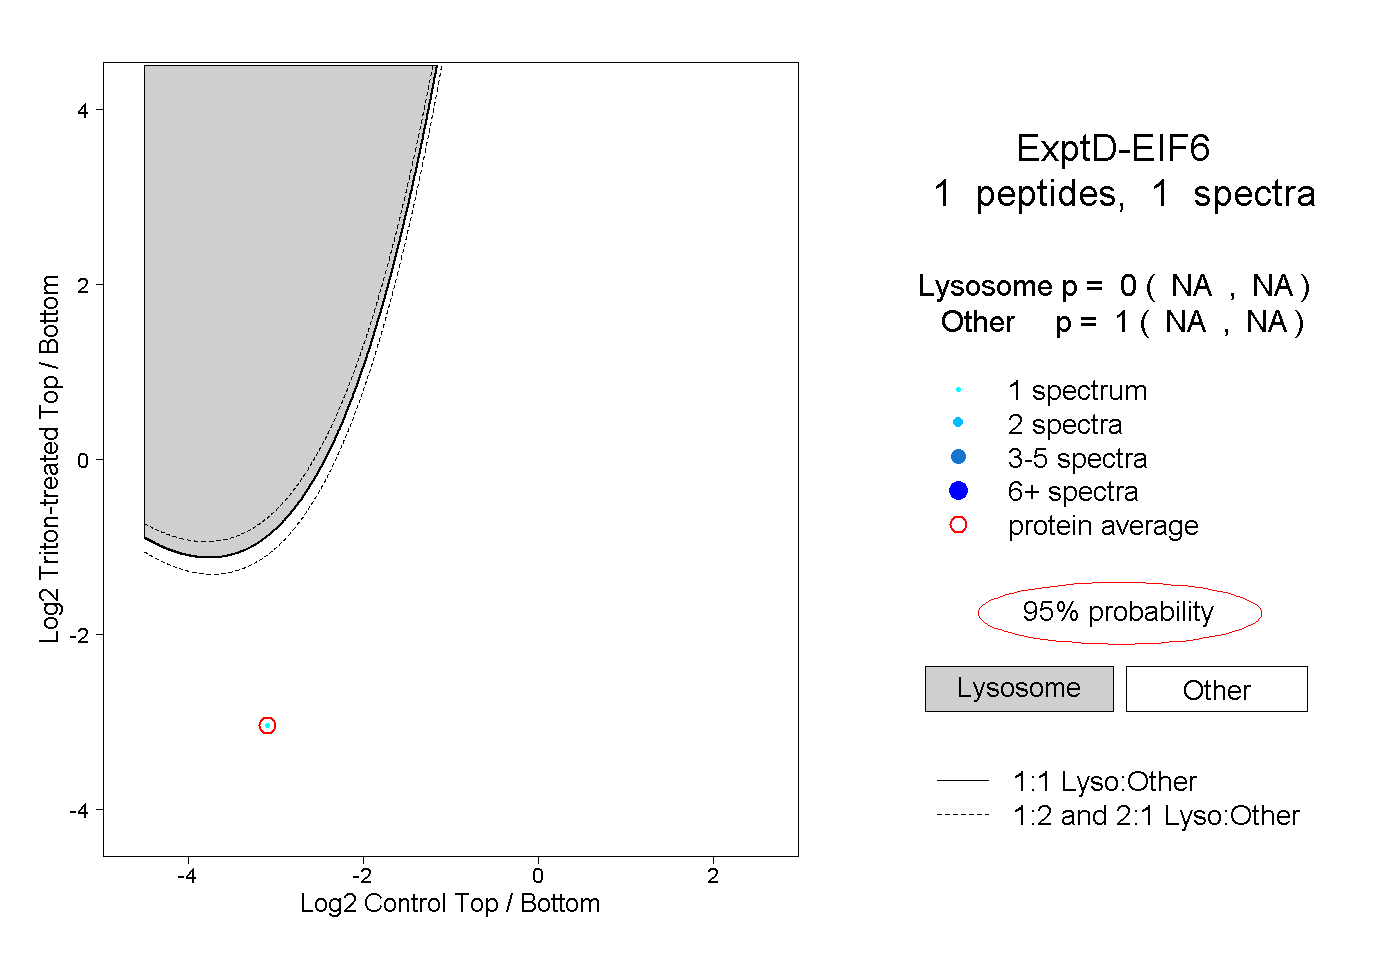
NA | NA
NA | NA