 11
11peptides
spectra
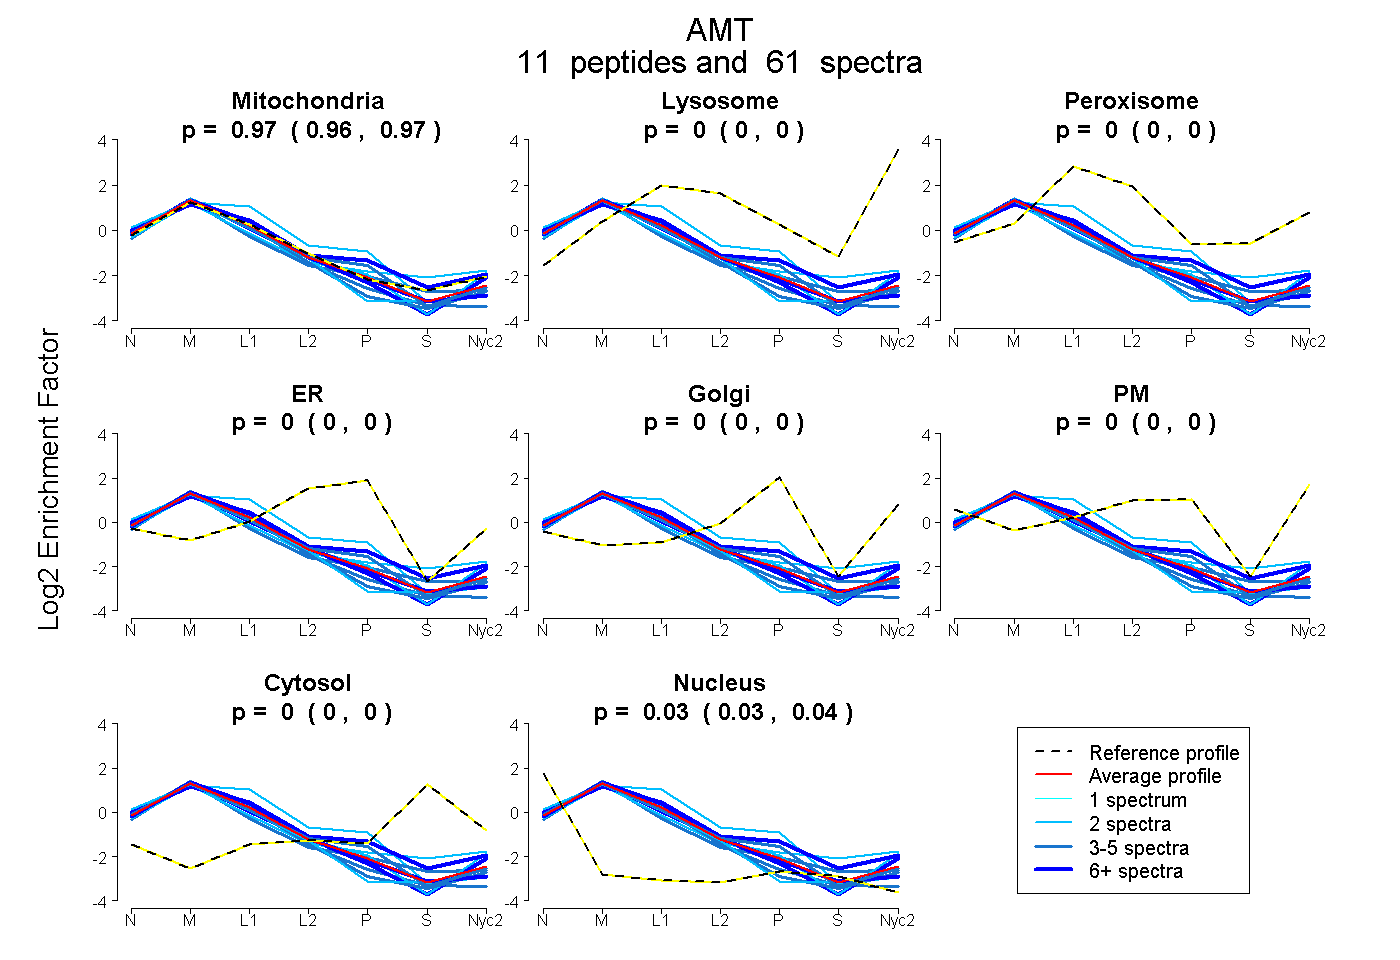
0.964 | 0.970
0.000 | 0.000
0.000 | 0.000
0.000 | 0.000
0.000 | 0.000
0.000 | 0.000
0.000 | 0.000
0.030 | 0.035
8peptides
spectra
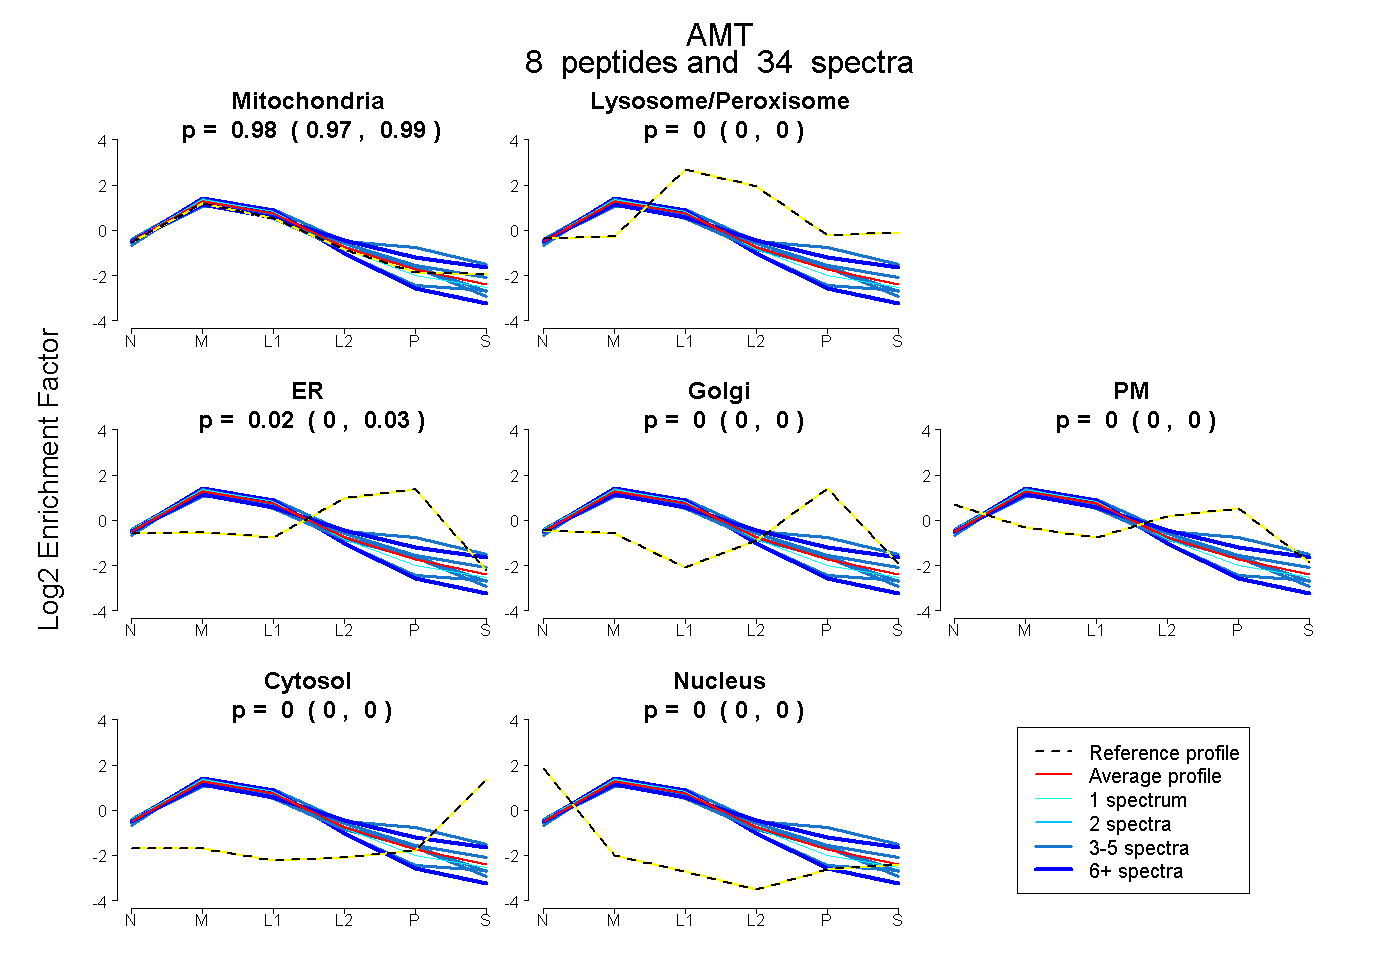
0.968 | 0.995
0.000 | 0.000
0.002 | 0.029
0.000 | 0.000
0.000 | 0.000
0.000 | 0.000
0.000 | 0.000
12peptides
spectra
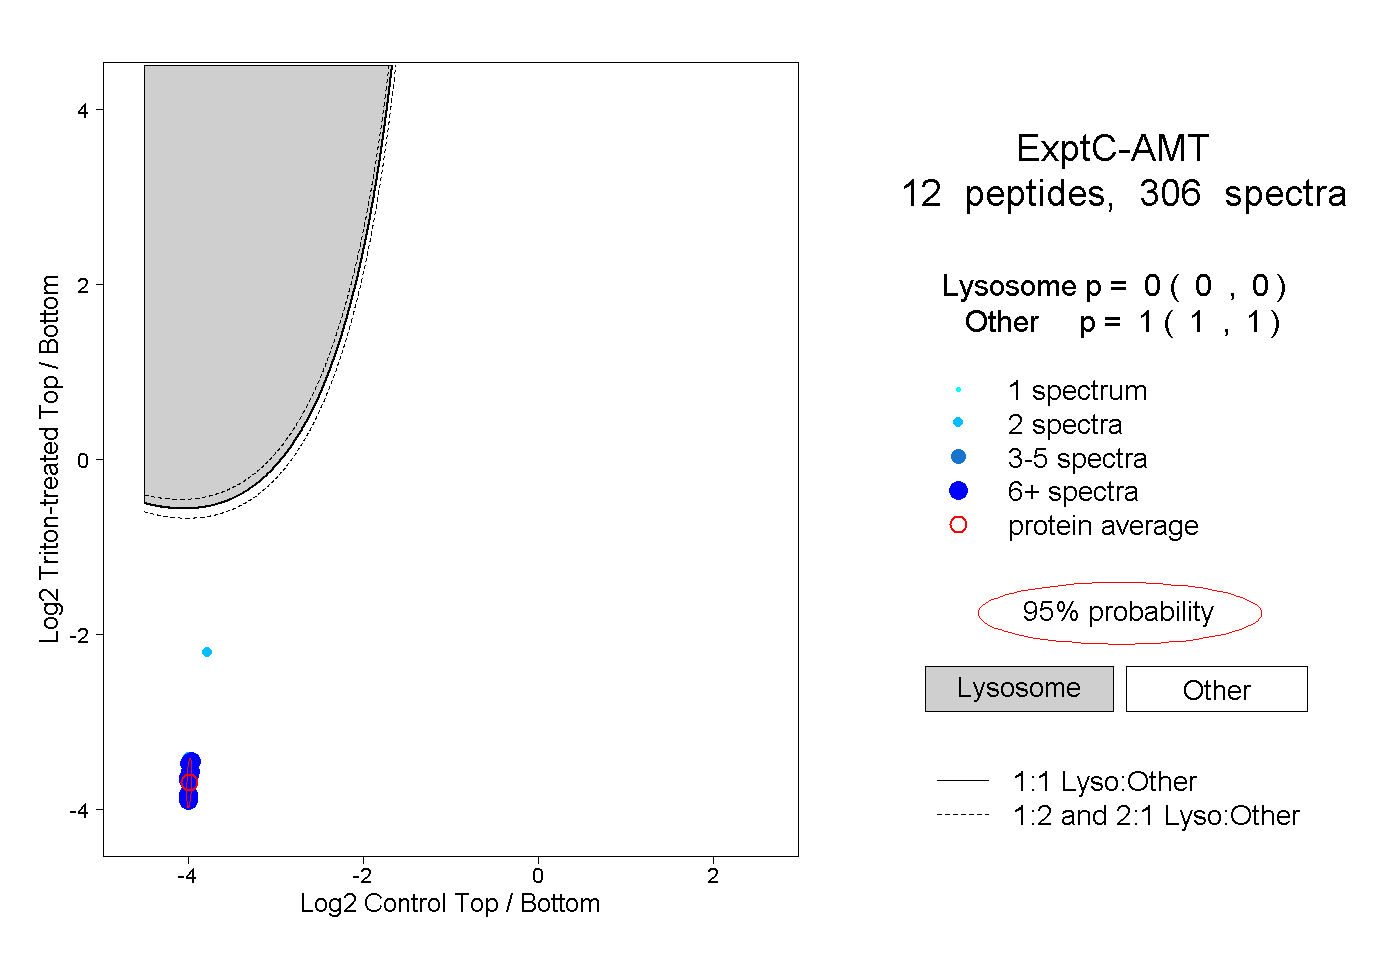
0.000 | 0.000
1.000 | 1.000
8peptides
spectra
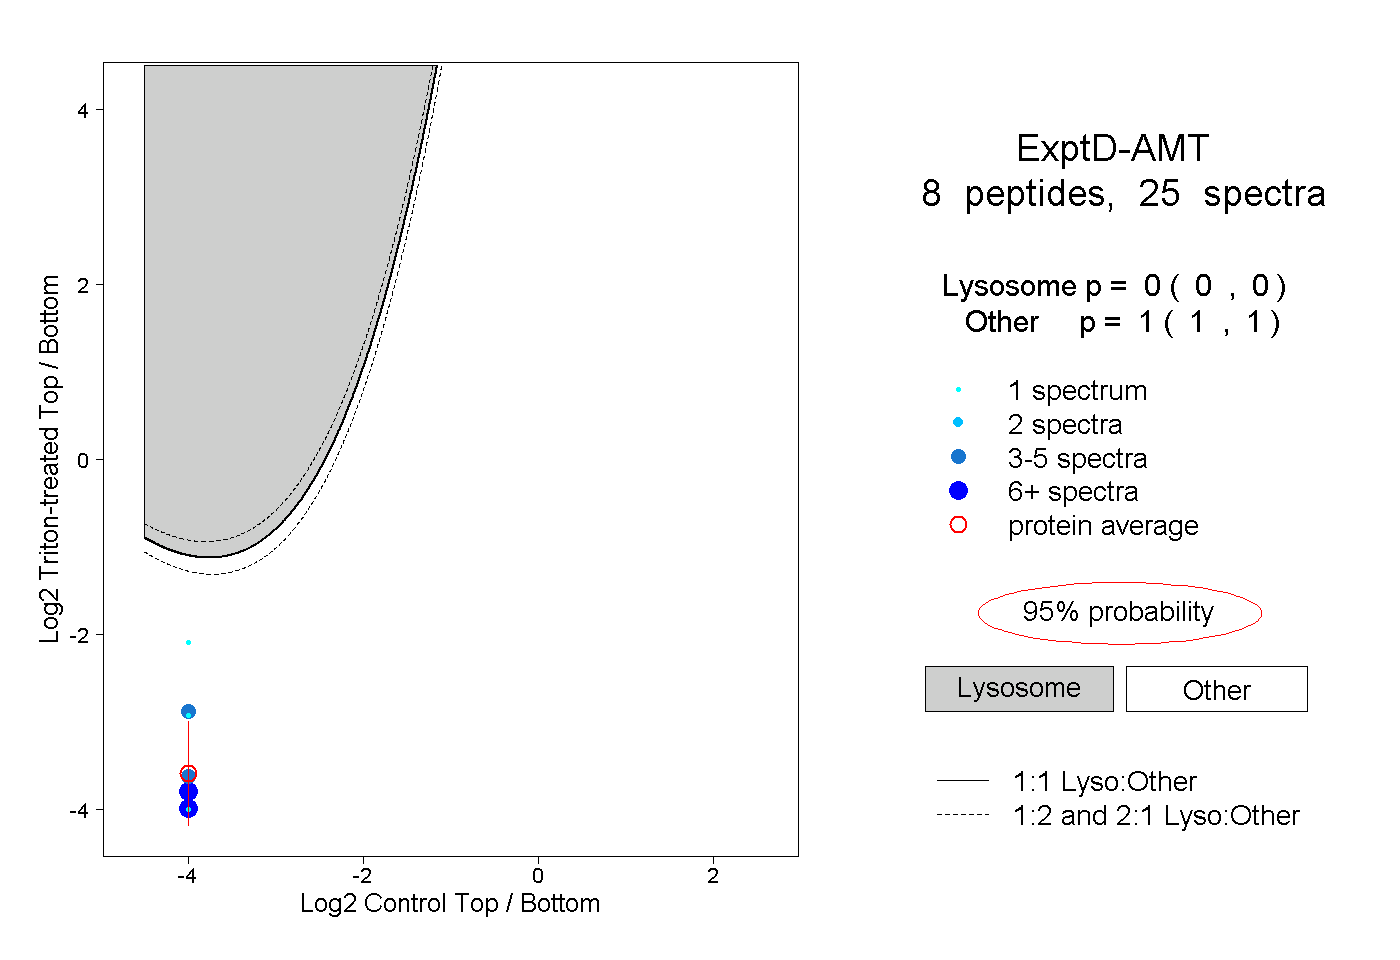
0.000 | 0.000
1.000 | 1.000