AMT
[ENSRNOP00000066155]
Main page
| | | Plot |
Mito |
Lyso |
|
Perox |
ER |
Golgi |
PM |
Cytosol |
Nucleus |
|
| Expt A |
 11
11
peptides |
61
spectra |
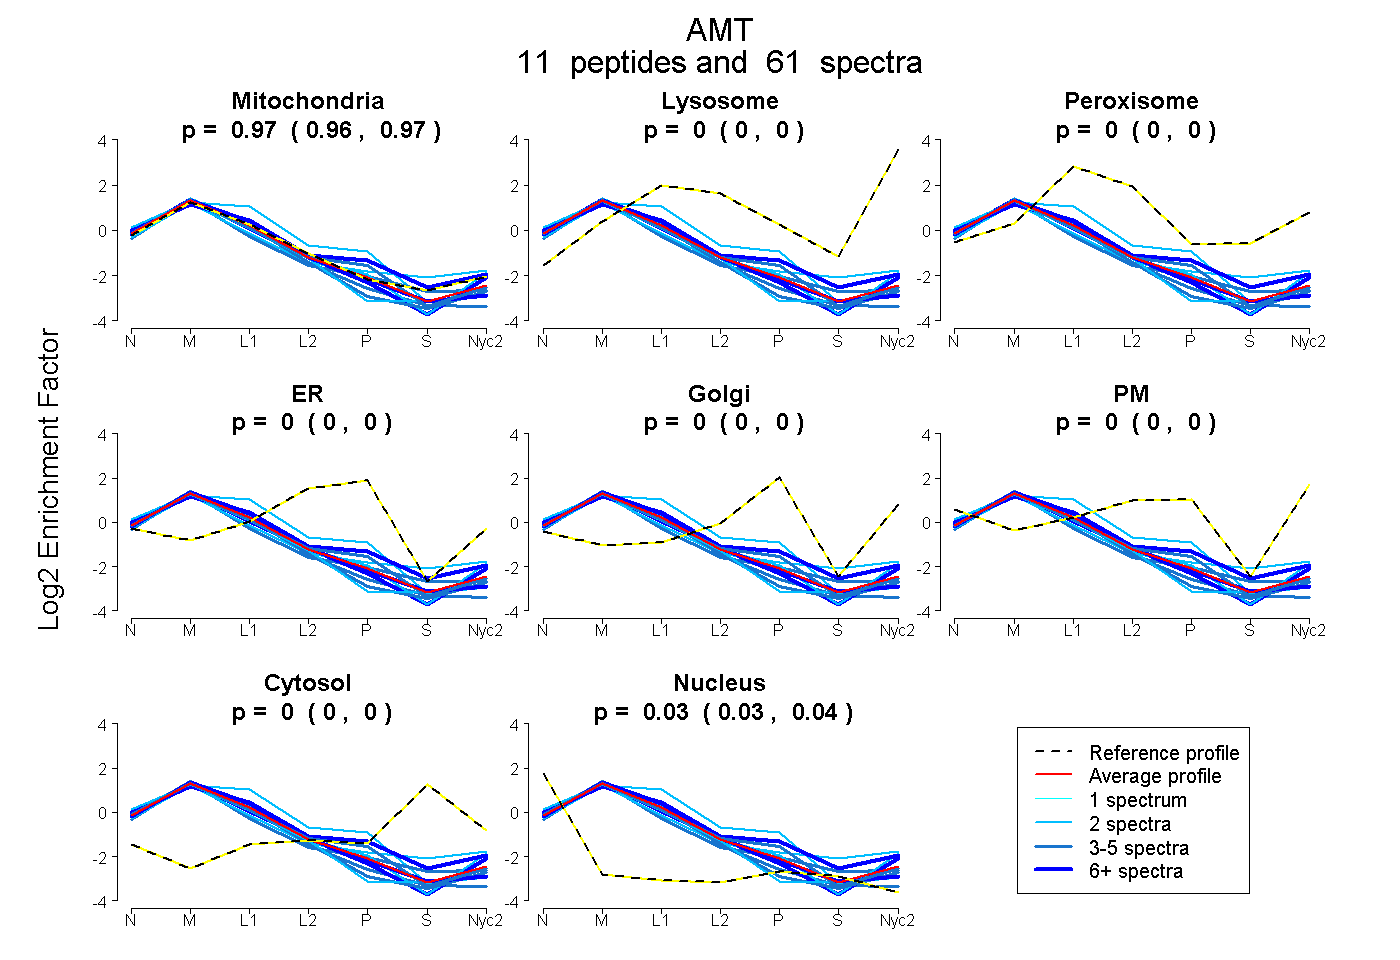 |
0.967
0.964 | 0.970 |
0.000
0.000 | 0.000 |
|
0.000
0.000 | 0.000 |
0.000
0.000 | 0.000 |
0.000
0.000 | 0.000 |
0.000
0.000 | 0.000 |
0.000
0.000 | 0.000 |
0.033
0.030 | 0.035 |
|
| | | Plot |
Mito |
|
Lyso or Perox |
|
ER |
Golgi |
PM |
Cytosol |
Nucleus |
|
| Expt B |
8
peptides |
34
spectra |
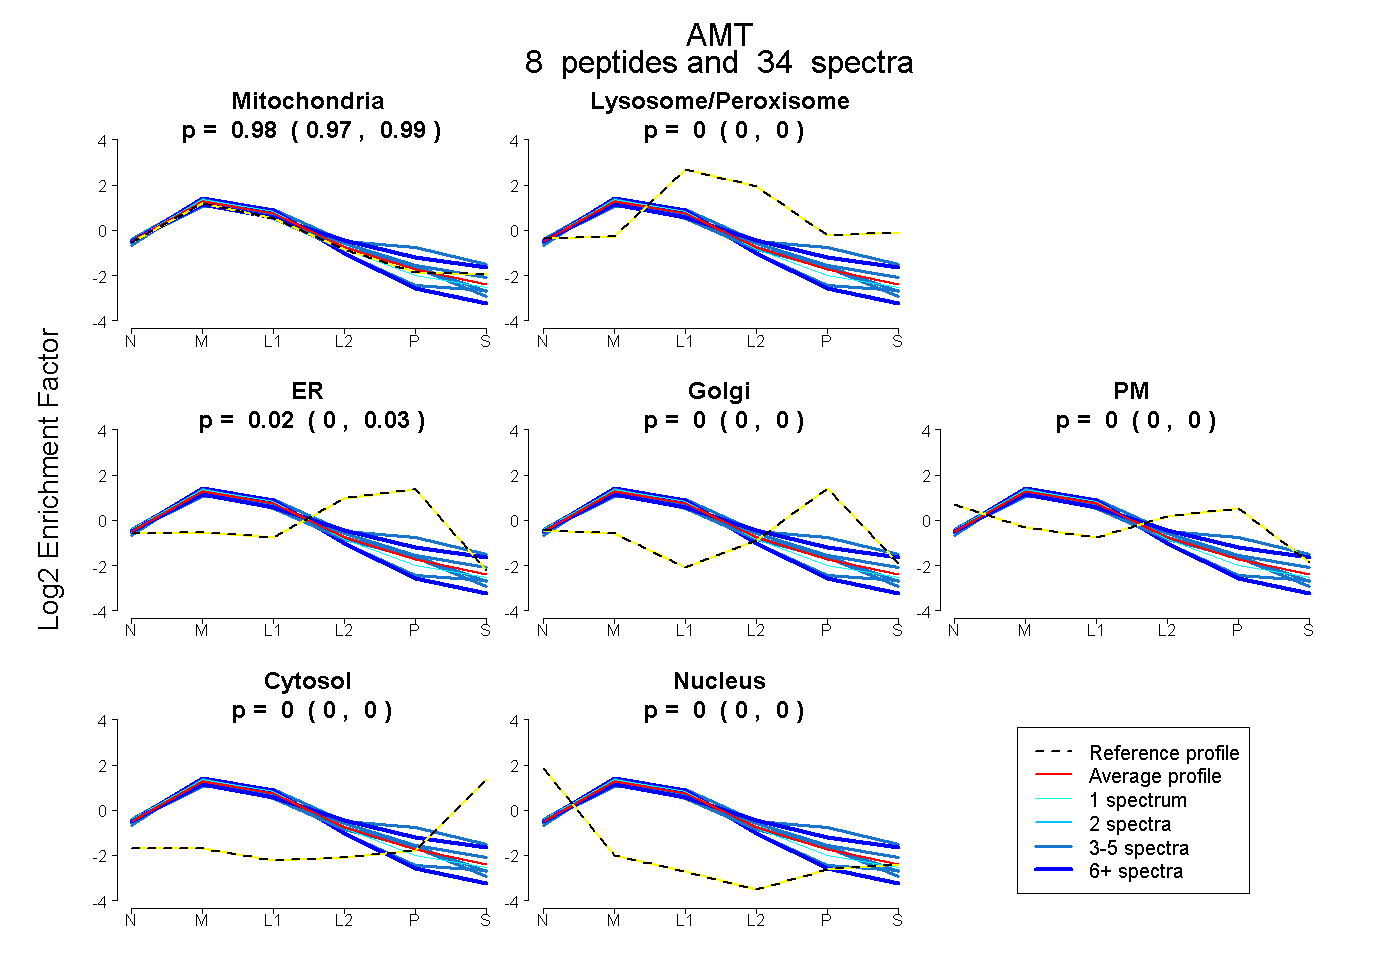 |
0.983
0.968 | 0.995 |
|
0.000
0.000 | 0.000 |
|
0.017
0.002 | 0.029 |
0.000
0.000 | 0.000 |
0.000
0.000 | 0.000 |
0.000
0.000 | 0.000 |
0.000
0.000 | 0.000 |
|
| 1 spectrum, VGLICEGAPMR |
1.000 |
|
0.000 |
|
0.000 |
0.000 |
0.000 |
0.000 |
0.000 |
|
| 8 spectra, YSRPGTQLLVEVR |
0.787 |
|
0.121 |
|
0.012 |
0.080 |
0.000 |
0.000 |
0.000 |
|
| 3 spectra, NVAMGYVAFK |
0.954 |
|
0.000 |
|
0.046 |
0.000 |
0.000 |
0.000 |
0.000 |
|
| 4 spectra, IIIPQLK |
1.000 |
|
0.000 |
|
0.000 |
0.000 |
0.000 |
0.000 |
0.000 |
|
| 3 spectra, TPLYDFHLAHGGK |
0.957 |
|
0.000 |
|
0.043 |
0.000 |
0.000 |
0.000 |
0.000 |
|
| 3 spectra, DSHVDSHLHTR |
0.676 |
|
0.211 |
|
0.000 |
0.113 |
0.000 |
0.000 |
0.000 |
|
| 3 spectra, VAMDFPGAK |
0.922 |
|
0.020 |
|
0.058 |
0.000 |
0.000 |
0.000 |
0.000 |
|
| 9 spectra, LAGLAAR |
1.000 |
|
0.000 |
|
0.000 |
0.000 |
0.000 |
0.000 |
0.000 |
|
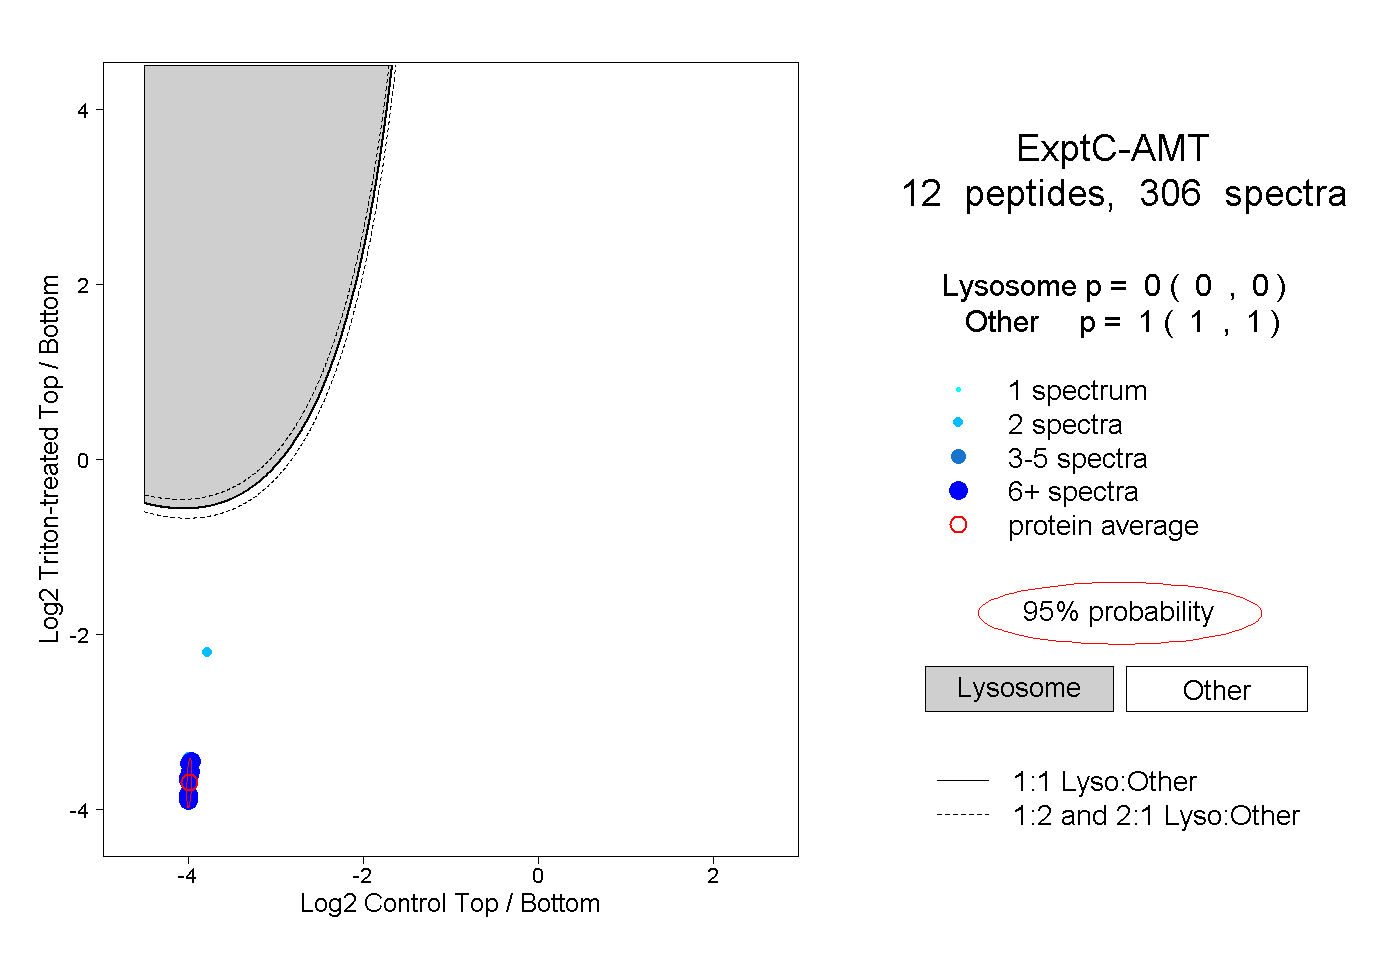
| | | Plot |
|
Lyso |
|
|
|
|
|
|
|
Other |
| Expt C |
12
peptides |
306
spectra |
 |
|
0.000
0.000 | 0.000 |
|
|
|
|
|
|
|
1.000
1.000 | 1.000 |
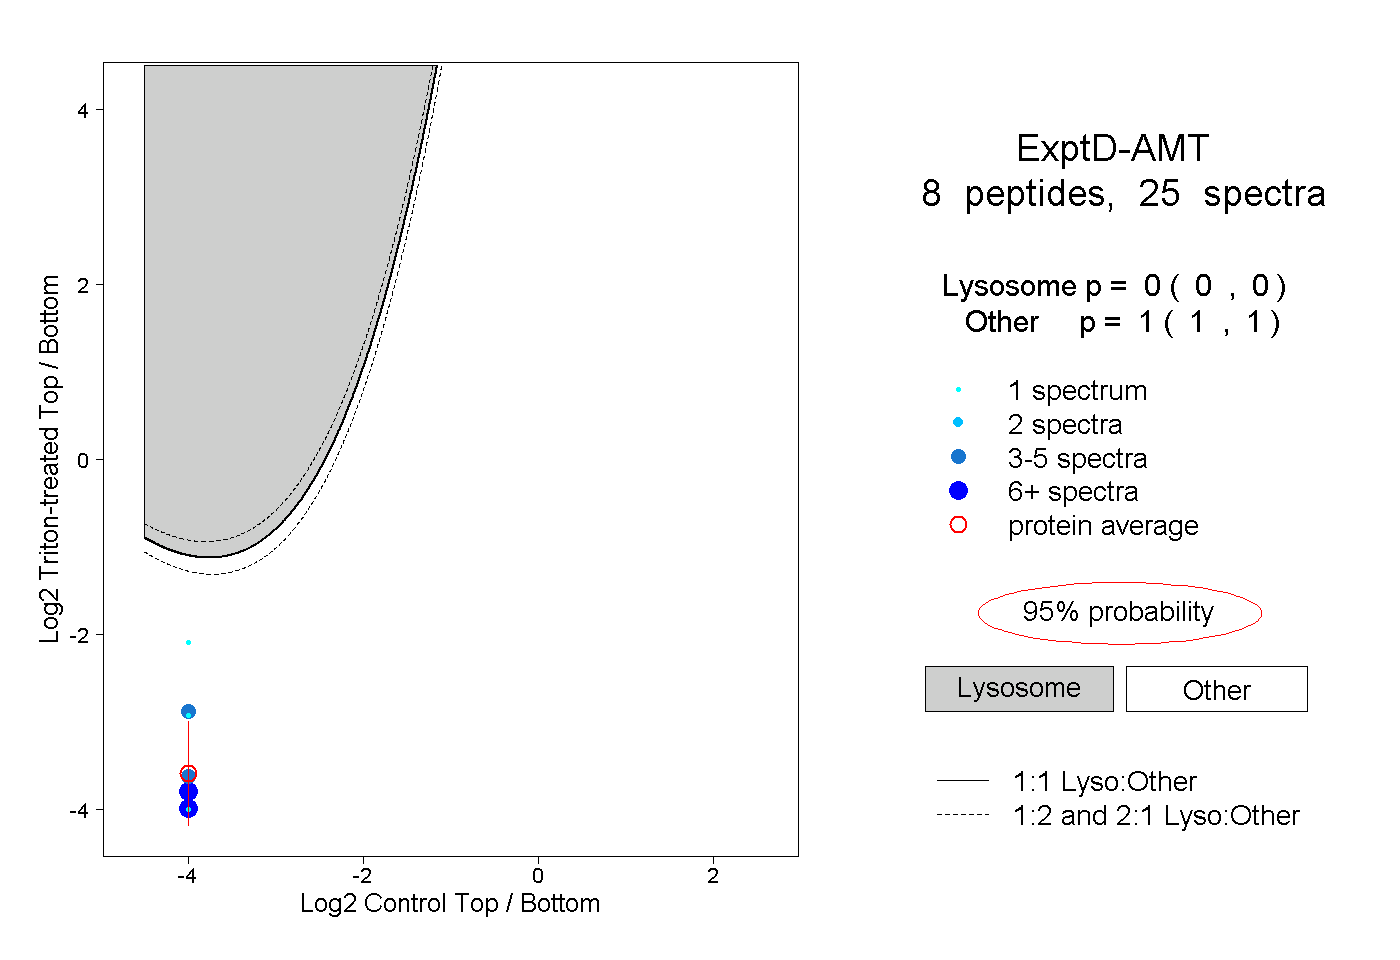
| | | Plot |
|
Lyso |
|
|
|
|
|
|
|
Other |
| Expt D |
8
peptides |
25
spectra |
 |
|
0.000
0.000 | 0.000 |
|
|
|
|
|
|
|
1.000
1.000 | 1.000 |