 11
11peptides
spectra
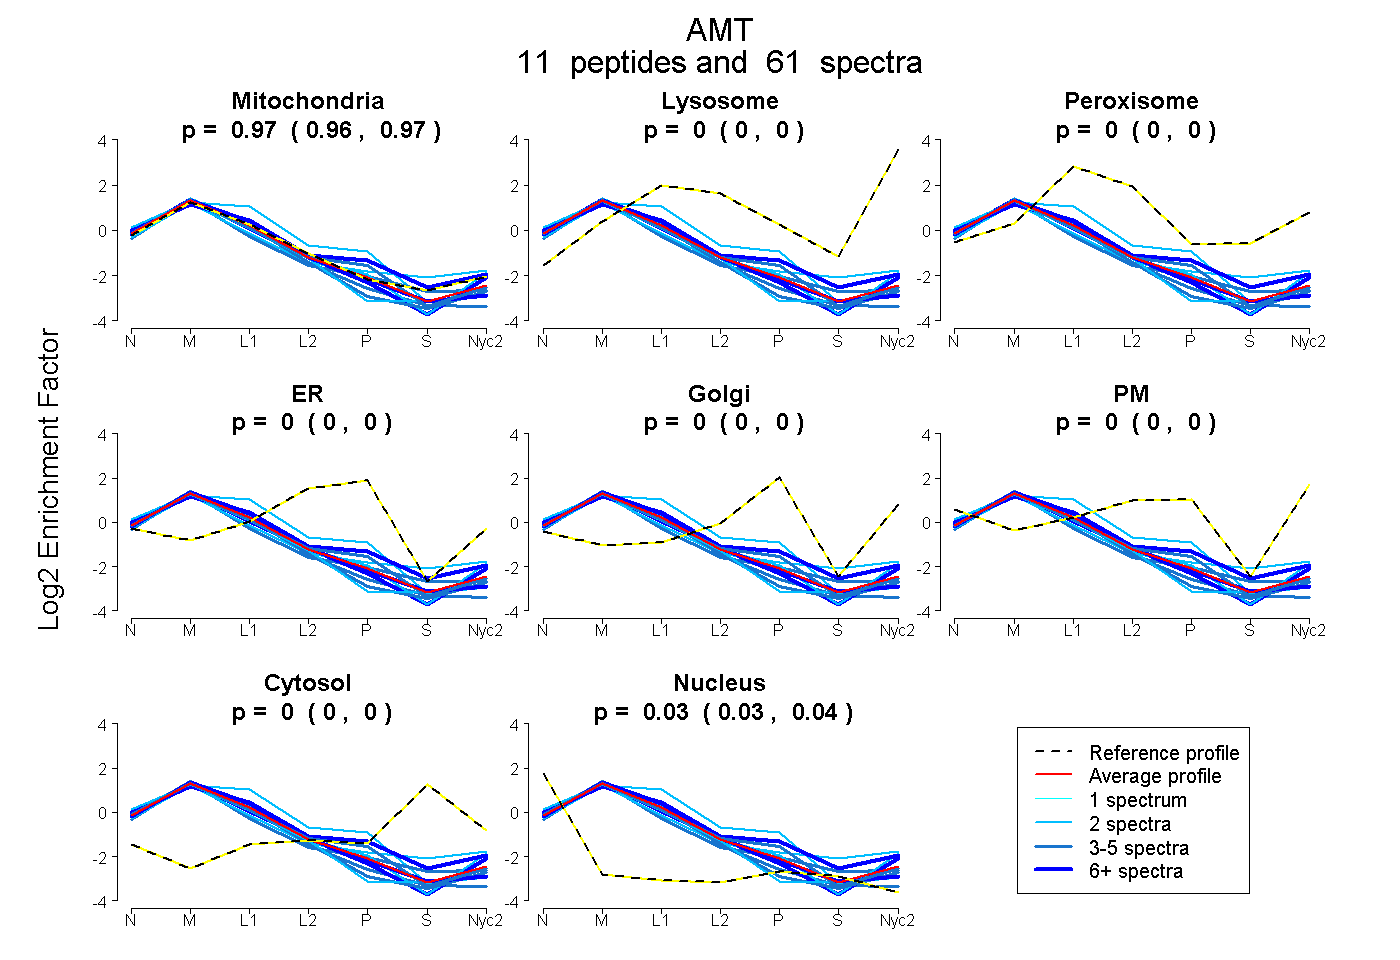
0.964 | 0.970
0.000 | 0.000
0.000 | 0.000
0.000 | 0.000
0.000 | 0.000
0.000 | 0.000
0.000 | 0.000
0.030 | 0.035
| Plot | Mito | Lyso | Perox | ER | Golgi | PM | Cytosol | Nucleus | |||||
| Expt A |
11 peptides |
61 spectra |
|
0.967 0.964 | 0.970 |
0.000 0.000 | 0.000 |
0.000 0.000 | 0.000 |
0.000 0.000 | 0.000 |
0.000 0.000 | 0.000 |
0.000 0.000 | 0.000 |
0.000 0.000 | 0.000 |
0.033 0.030 | 0.035 |
| 9 spectra, VGLICEGAPMR | 0.971 | 0.000 | 0.000 | 0.000 | 0.000 | 0.000 | 0.000 | 0.029 | ||
| 3 spectra, YSRPGTQLLVEVR | 0.917 | 0.000 | 0.000 | 0.043 | 0.000 | 0.000 | 0.000 | 0.040 | ||
| 2 spectra, NVAMGYVAFK | 0.877 | 0.000 | 0.000 | 0.000 | 0.029 | 0.000 | 0.095 | 0.000 | ||
| 5 spectra, QQMTVVSK | 0.939 | 0.000 | 0.000 | 0.000 | 0.000 | 0.000 | 0.000 | 0.061 | ||
| 3 spectra, IFGCDR | 0.914 | 0.000 | 0.000 | 0.000 | 0.000 | 0.000 | 0.000 | 0.086 | ||
| 3 spectra, IIIPQLK | 0.909 | 0.000 | 0.000 | 0.000 | 0.000 | 0.000 | 0.000 | 0.091 | ||
| 10 spectra, TPLYDFHLAHGGK | 0.880 | 0.000 | 0.000 | 0.063 | 0.057 | 0.000 | 0.000 | 0.000 | ||
| 2 spectra, DSHVDSHLHTR | 0.859 | 0.000 | 0.000 | 0.141 | 0.000 | 0.000 | 0.000 | 0.000 | ||
| 2 spectra, VAMDFPGAK | 0.925 | 0.000 | 0.000 | 0.000 | 0.000 | 0.000 | 0.000 | 0.075 | ||
| 20 spectra, LAGLAAR | 0.969 | 0.000 | 0.000 | 0.000 | 0.000 | 0.000 | 0.000 | 0.031 | ||
| 2 spectra, MPFVPTK | 0.981 | 0.000 | 0.000 | 0.000 | 0.019 | 0.000 | 0.000 | 0.000 |
| Plot | Mito | Lyso or Perox | ER | Golgi | PM | Cytosol | Nucleus | ||||||
| Expt B |
8 peptides |
34 spectra |
 |
0.983 0.968 | 0.995 |
0.000 0.000 | 0.000 |
0.017 0.002 | 0.029 |
0.000 0.000 | 0.000 |
0.000 0.000 | 0.000 |
0.000 0.000 | 0.000 |
0.000 0.000 | 0.000 |
|||
| Plot | Lyso | Other | |||||||||||
| Expt C |
12 peptides |
306 spectra |
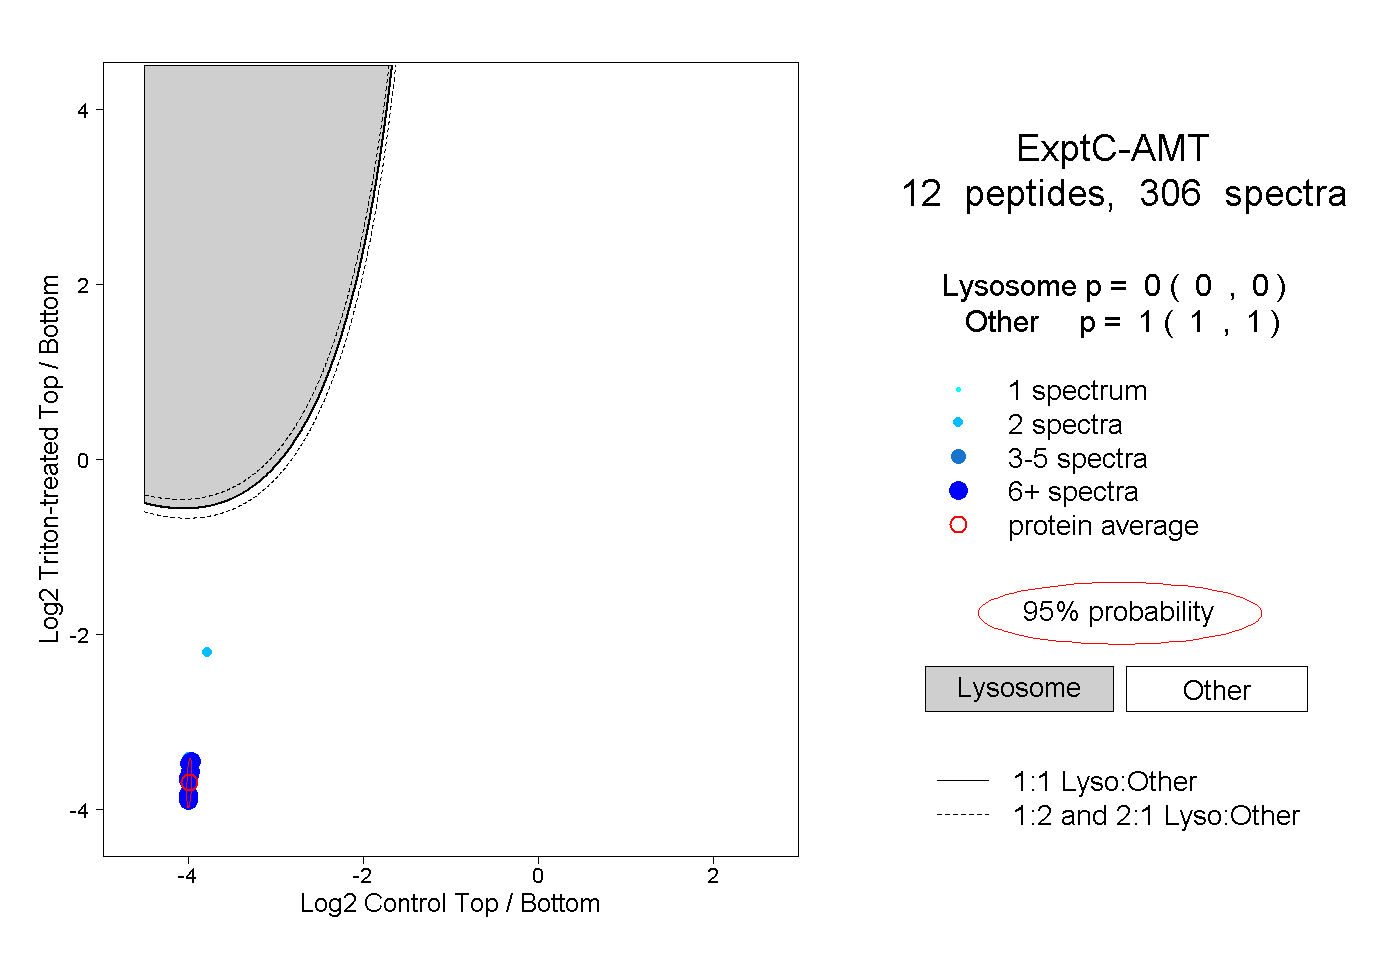 |
0.000 0.000 | 0.000 |
1.000 1.000 | 1.000 |
||||||||
| Plot | Lyso | Other | |||||||||||
| Expt D |
8 peptides |
25 spectra |
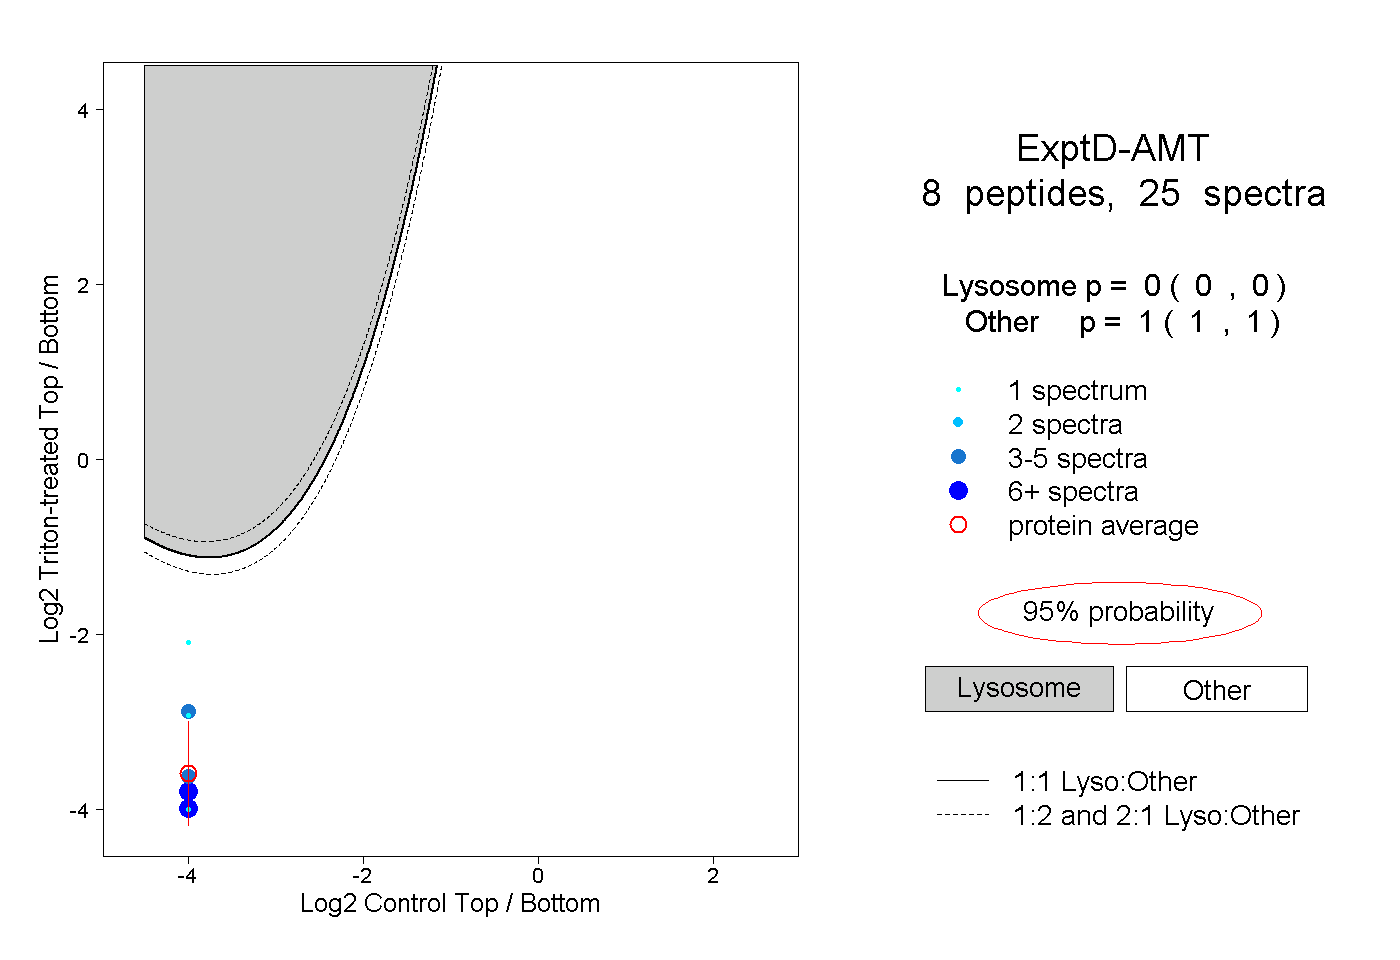 |
0.000 0.000 | 0.000 |
1.000 1.000 | 1.000 |