28
28peptides
spectra
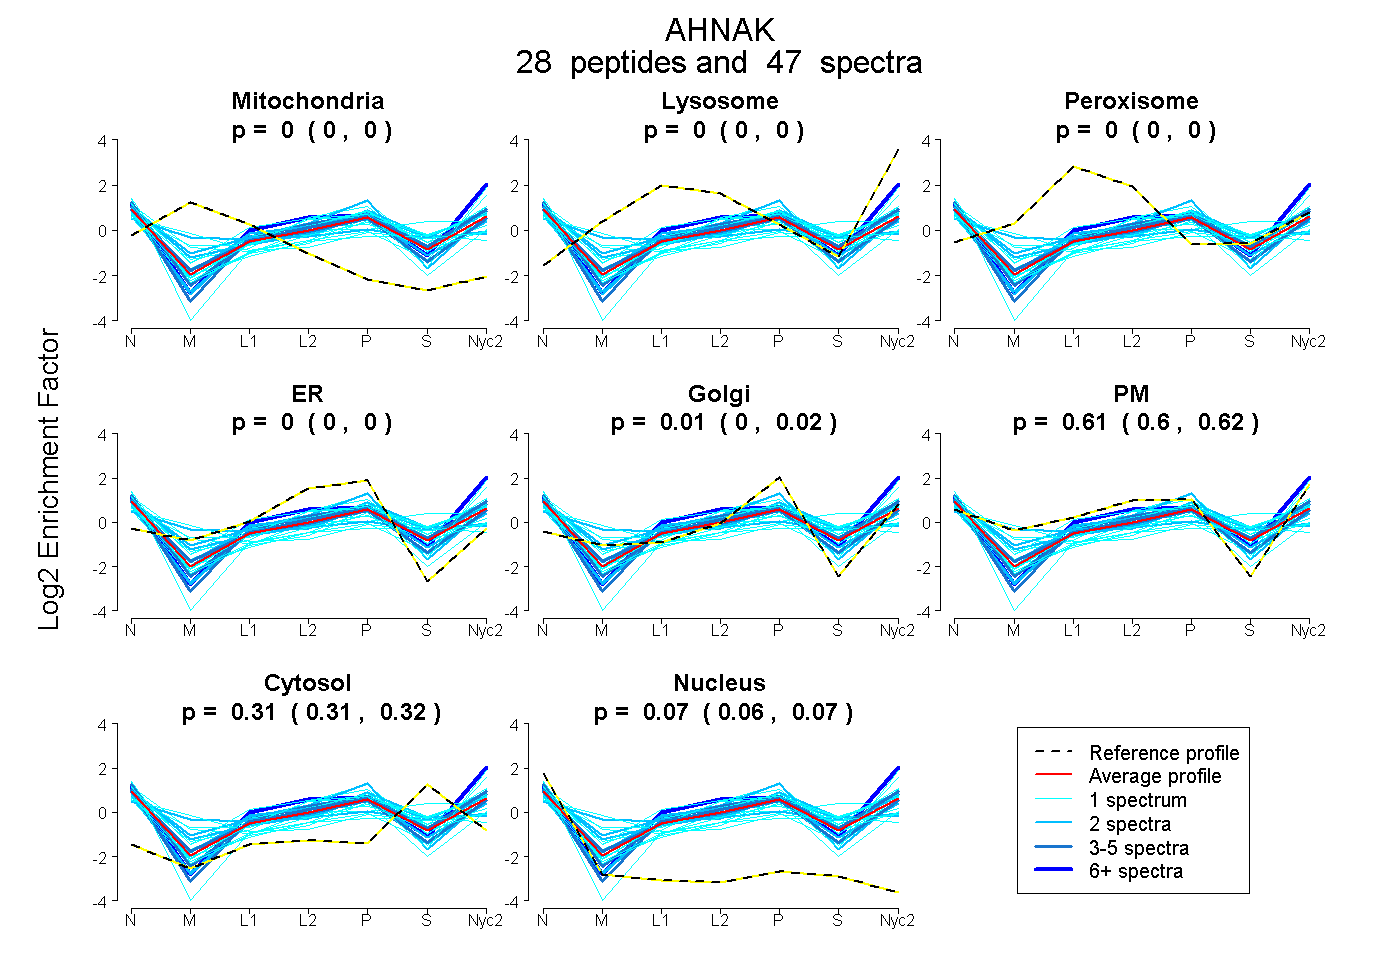
0.000 | 0.000
0.000 | 0.000
0.000 | 0.000
0.000 | 0.000
0.000 | 0.017
0.601 | 0.619
0.306 | 0.317
0.064 | 0.071
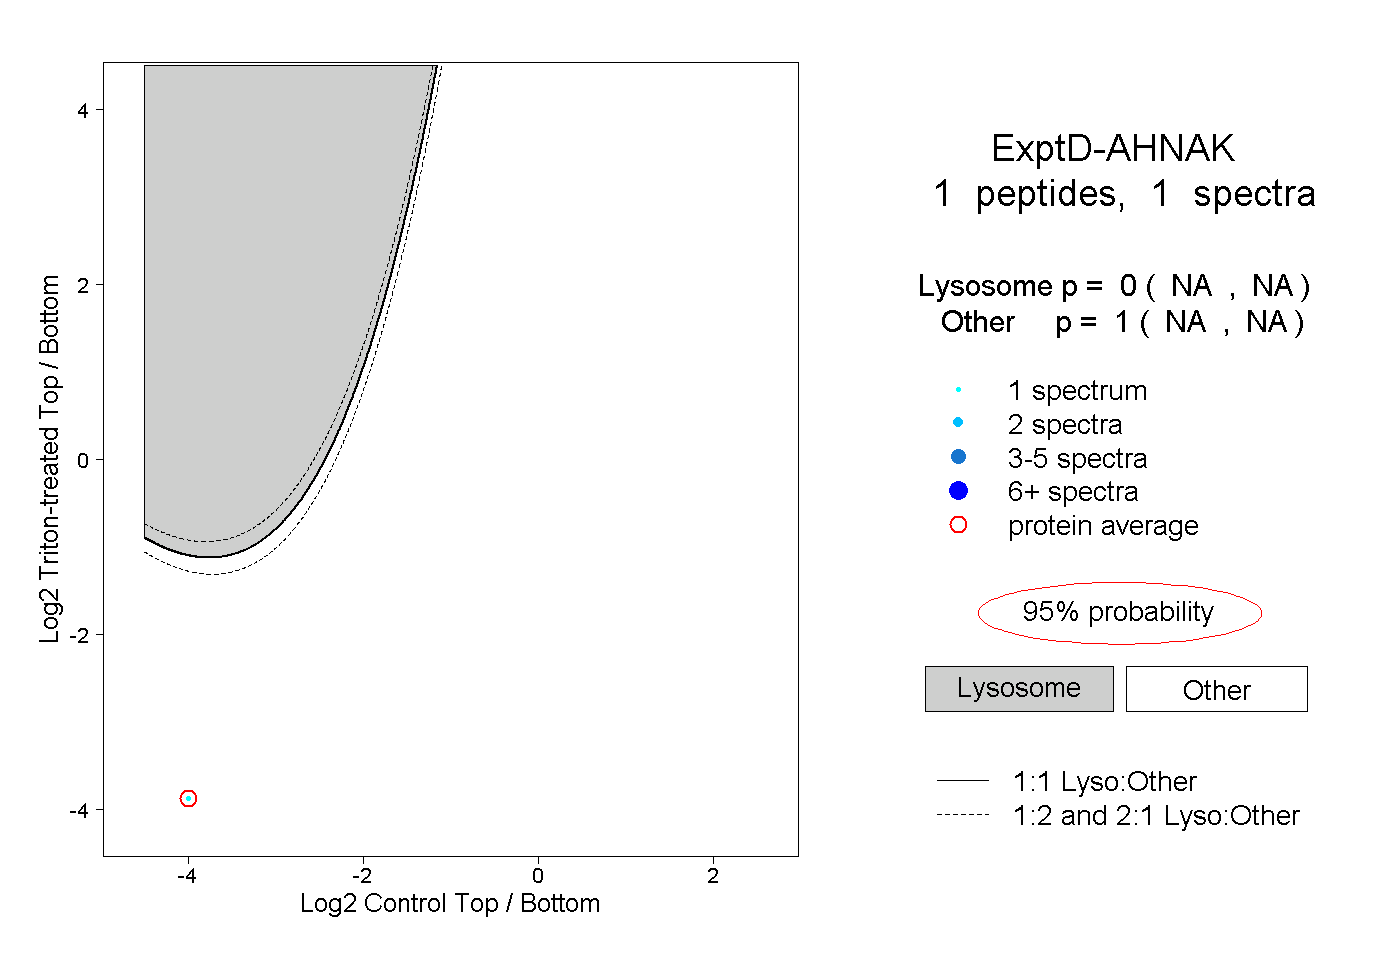
2peptides
spectra
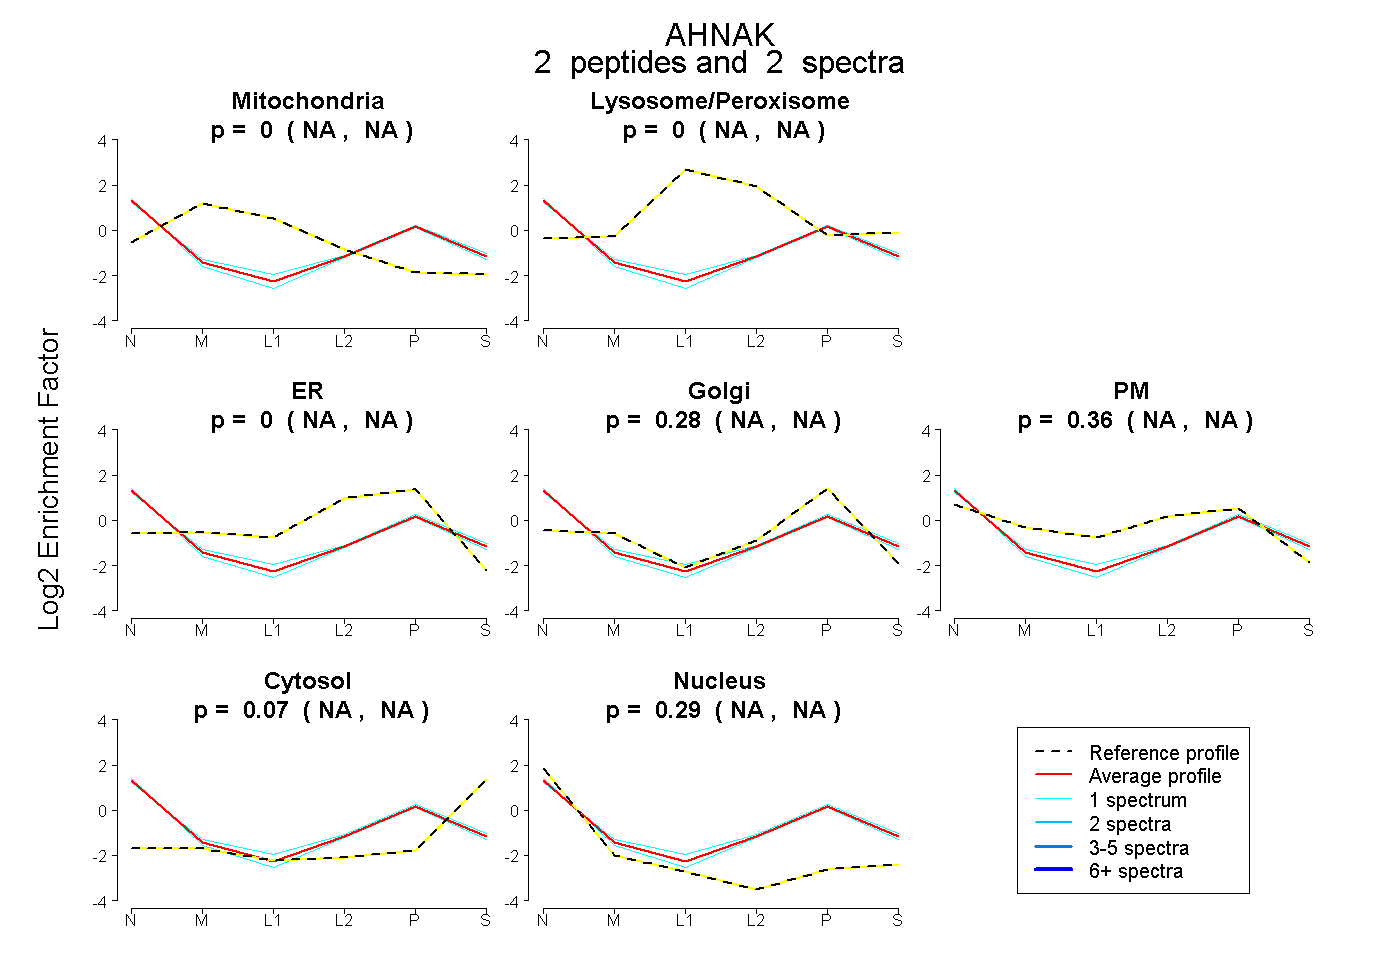
NA | NA
NA | NA
NA | NA
NA | NA
NA | NA
NA | NA
NA | NA
11peptides
spectra
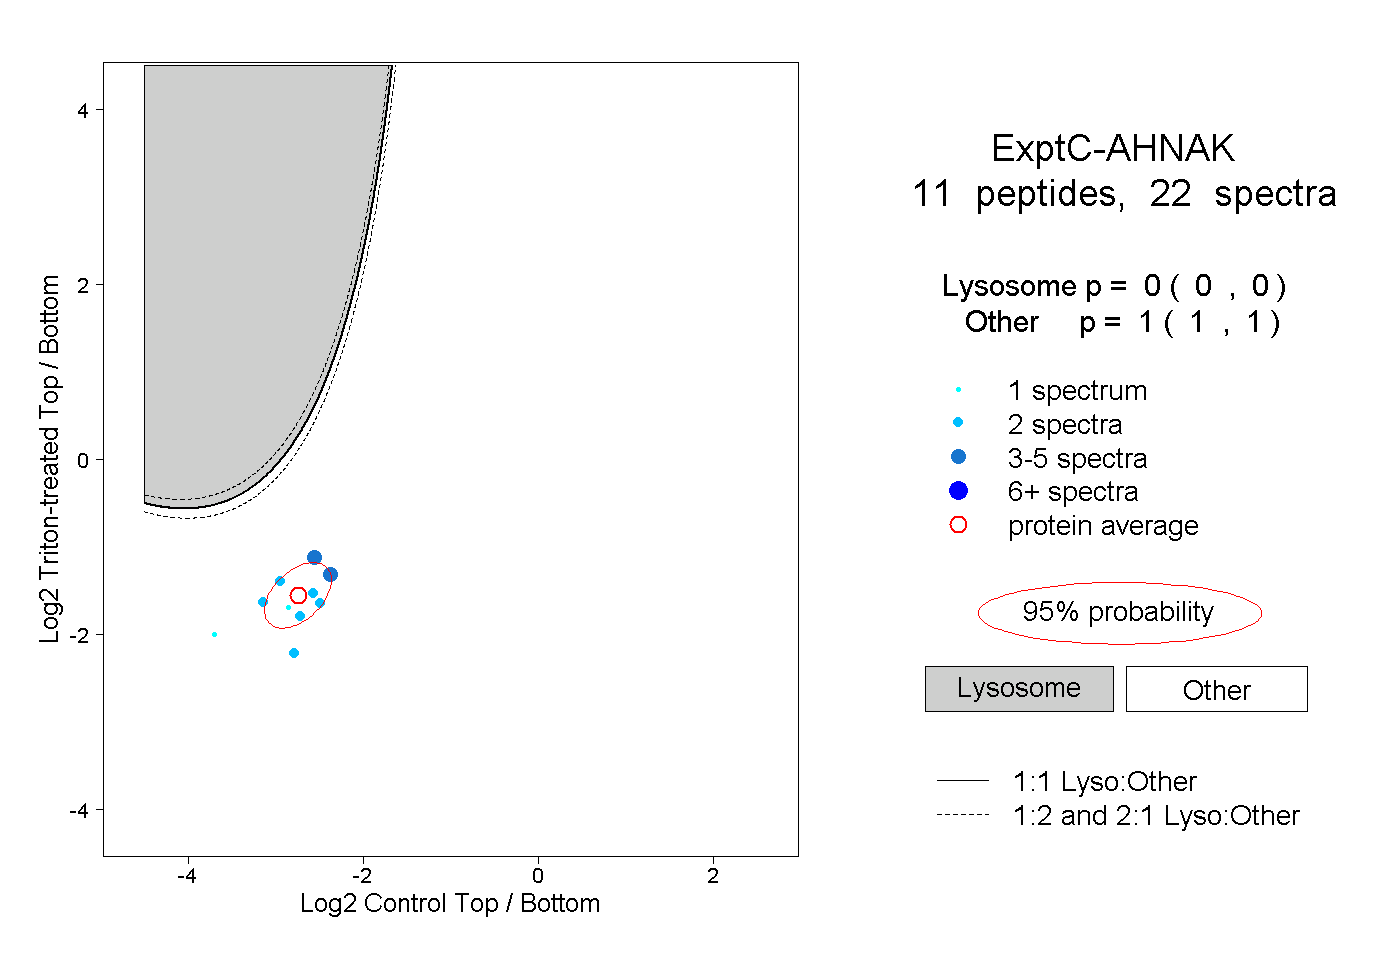
0.000 | 0.000
1.000 | 1.000