 28
28peptides
spectra
0.000 | 0.000
0.000 | 0.000
0.000 | 0.000
0.000 | 0.000
0.000 | 0.017
0.601 | 0.619
0.306 | 0.317
0.064 | 0.071
2peptides
spectra
NA | NA
NA | NA
NA | NA
NA | NA
NA | NA
NA | NA
NA | NA
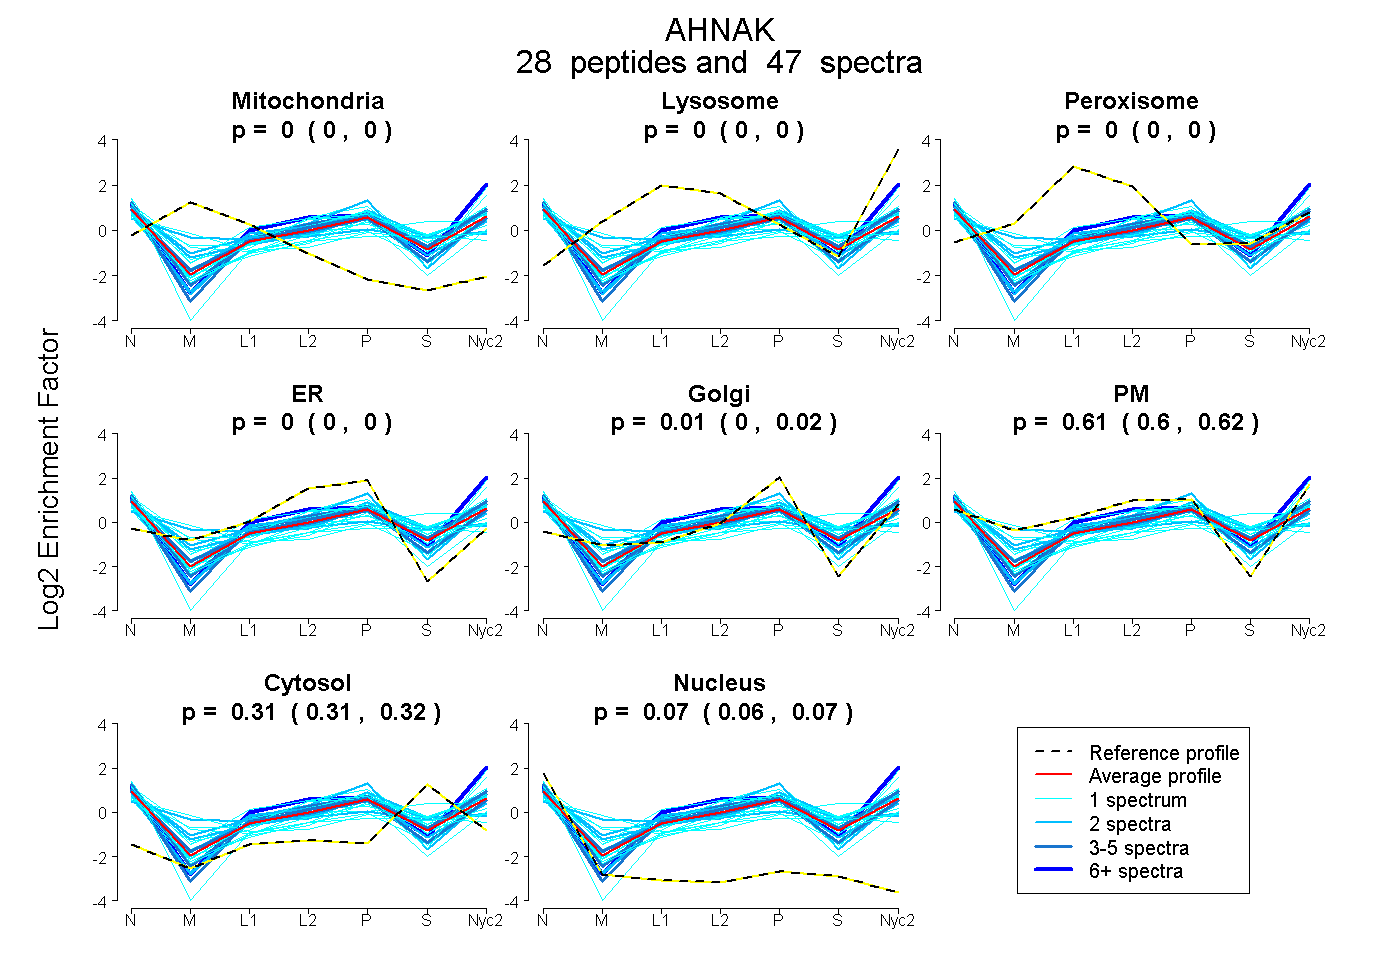
| Plot | Mito | Lyso | Perox | ER | Golgi | PM | Cytosol | Nucleus | |||||
| Expt A |
28 peptides |
47 spectra |
|
0.000 0.000 | 0.000 |
0.000 0.000 | 0.000 |
0.000 0.000 | 0.000 |
0.000 0.000 | 0.000 |
0.009 0.000 | 0.017 |
0.611 0.601 | 0.619 |
0.312 0.306 | 0.317 |
0.068 0.064 | 0.071 |
||
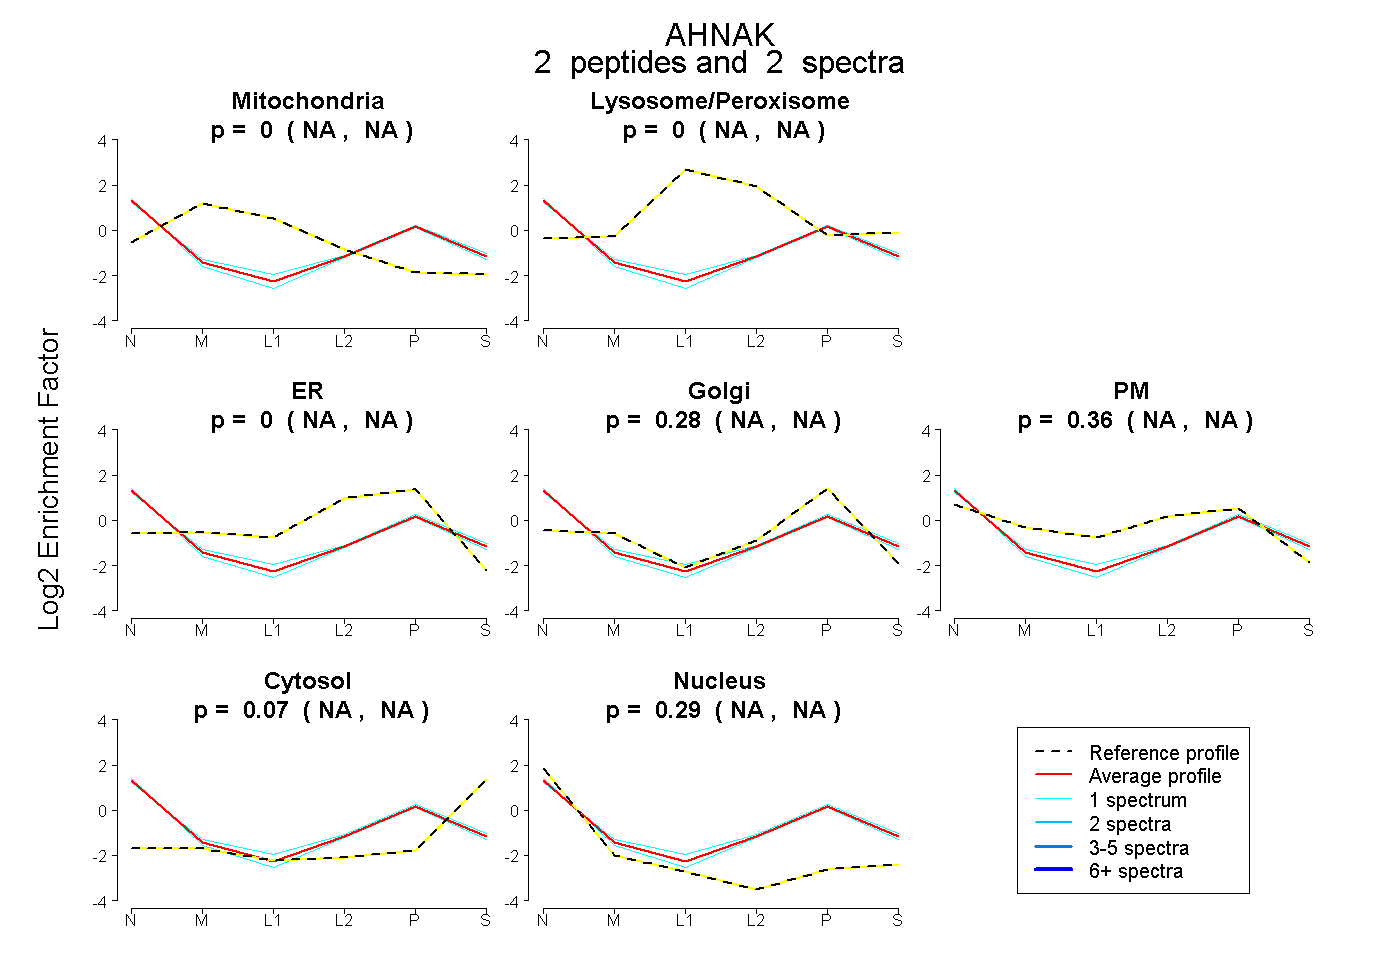
| Plot | Mito | Lyso or Perox | ER | Golgi | PM | Cytosol | Nucleus | ||||||
| Expt B |
2 peptides |
2 spectra |
|
0.000 NA | NA |
0.000 NA | NA |
0.000 NA | NA |
0.279 NA | NA |
0.362 NA | NA |
0.072 NA | NA |
0.287 NA | NA |
| 1 spectrum, VDIDVPDVNIEGPDAK | 0.000 | 0.000 | 0.000 | 0.205 | 0.459 | 0.103 | 0.233 | |||
| 1 spectrum, AEGPEVDVSLPK | 0.000 | 0.000 | 0.000 | 0.353 | 0.264 | 0.041 | 0.341 |
| Plot | Lyso | Other | |||||||||||
| Expt C |
11 peptides |
22 spectra |
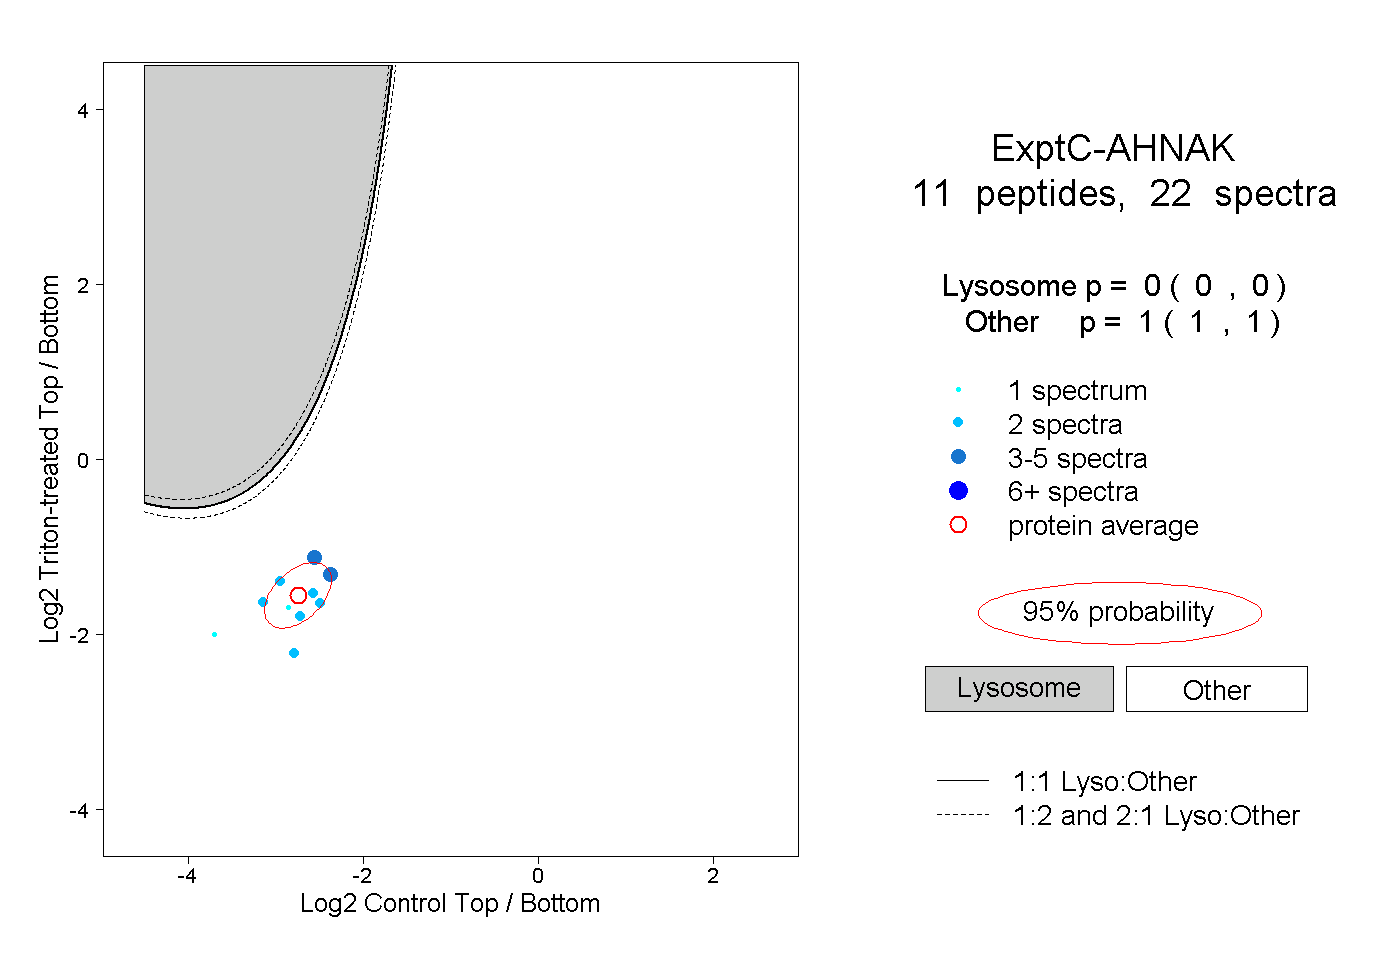 |
0.000 0.000 | 0.000 |
1.000 1.000 | 1.000 |
||||||||
| Plot | Lyso | Other | |||||||||||
| Expt D |
1 peptide |
1 spectrum |
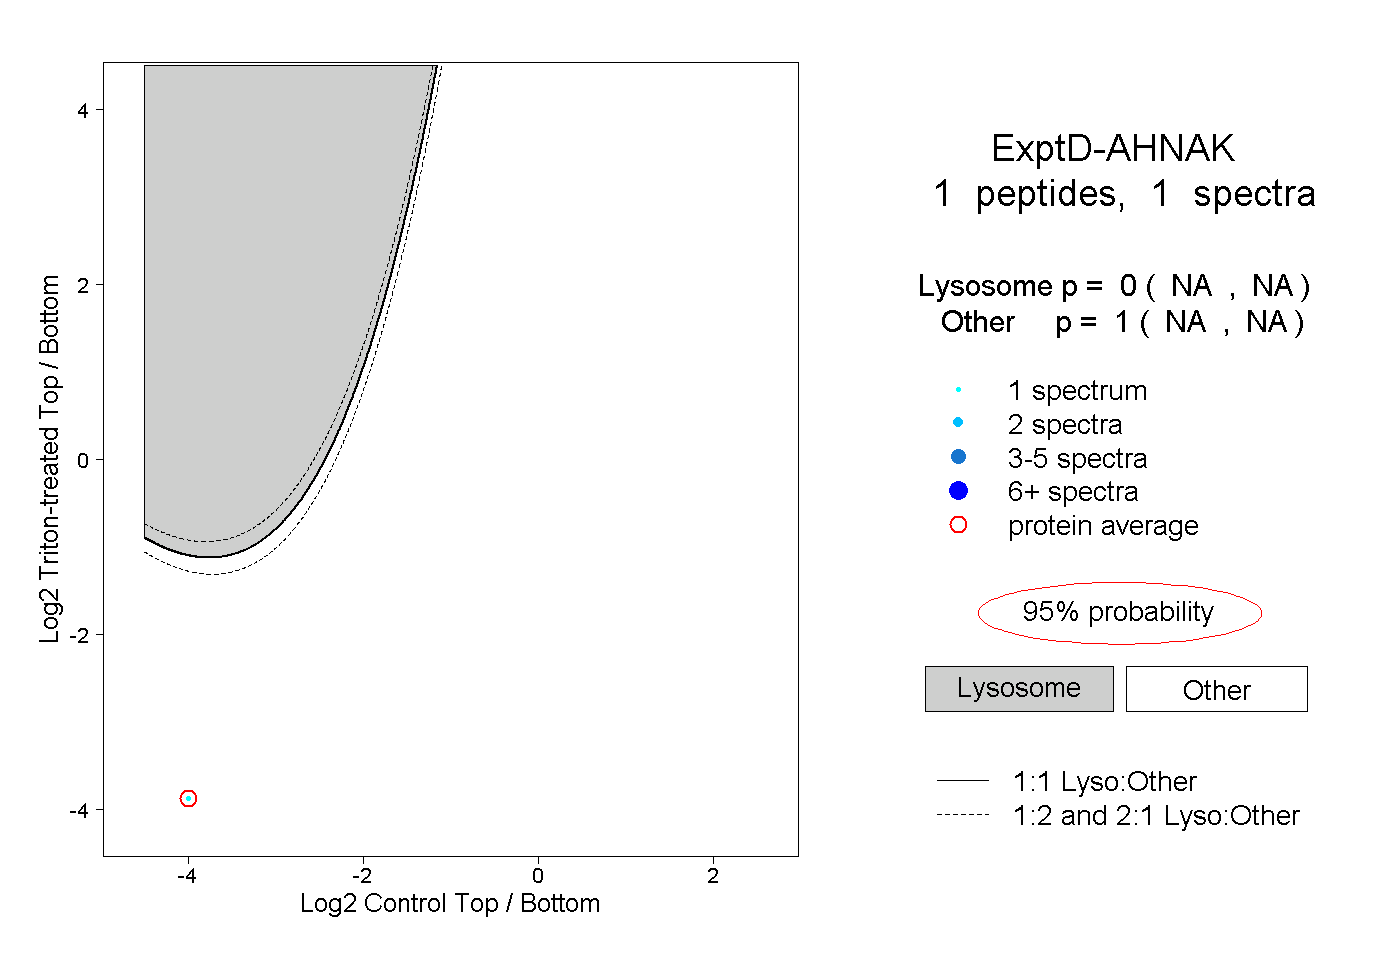 |
0.000 NA | NA |
1.000 NA | NA |