 28
28peptides
spectra
0.000 | 0.000
0.000 | 0.000
0.000 | 0.000
0.000 | 0.000
0.000 | 0.017
0.601 | 0.619
0.306 | 0.317
0.064 | 0.071
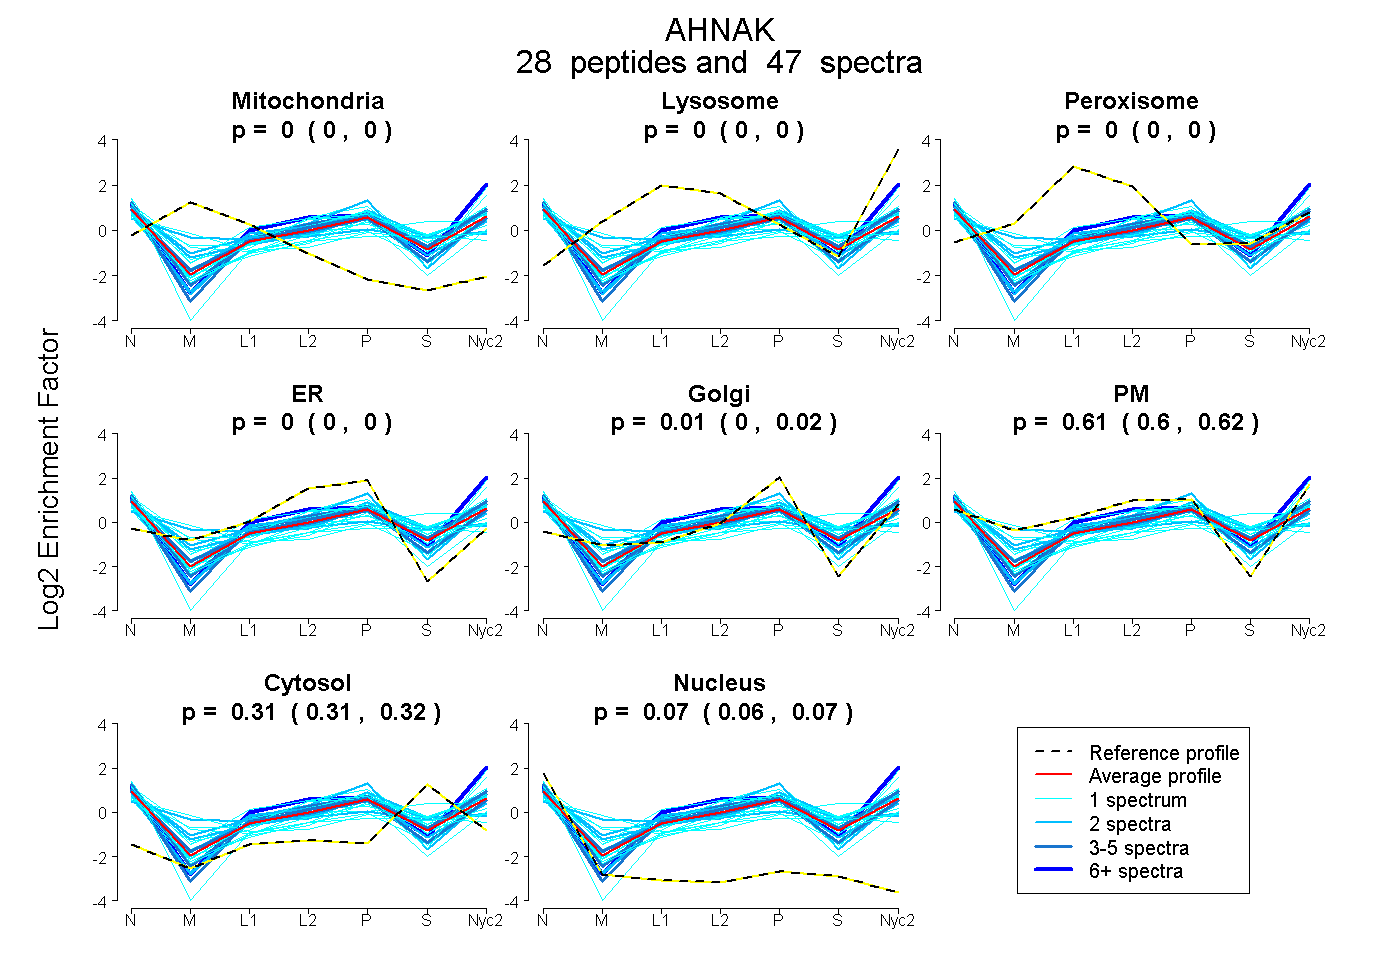
| Plot | Mito | Lyso | Perox | ER | Golgi | PM | Cytosol | Nucleus | |||||
| Expt A |
28 peptides |
47 spectra |
|
0.000 0.000 | 0.000 |
0.000 0.000 | 0.000 |
0.000 0.000 | 0.000 |
0.000 0.000 | 0.000 |
0.009 0.000 | 0.017 |
0.611 0.601 | 0.619 |
0.312 0.306 | 0.317 |
0.068 0.064 | 0.071 |
| 1 spectrum, ISMPNIDLNLK | 0.000 | 0.000 | 0.000 | 0.093 | 0.050 | 0.468 | 0.359 | 0.030 | ||
| 2 spectra, AEGPEVDVNLPK | 0.000 | 0.000 | 0.000 | 0.198 | 0.103 | 0.221 | 0.434 | 0.044 | ||
| 1 spectrum, VQTPEVDVK | 0.000 | 0.000 | 0.000 | 0.000 | 0.030 | 0.500 | 0.298 | 0.172 | ||
| 2 spectra, LPSGSGAASPTTGSAVDIR | 0.153 | 0.000 | 0.027 | 0.000 | 0.000 | 0.462 | 0.359 | 0.000 | ||
| 1 spectrum, VEGDLK | 0.000 | 0.000 | 0.000 | 0.000 | 0.000 | 0.595 | 0.405 | 0.000 | ||
| 1 spectrum, VPEVDIK | 0.000 | 0.000 | 0.000 | 0.000 | 0.000 | 0.863 | 0.132 | 0.005 | ||
| 1 spectrum, VDVDVPDVDVQGPDWHLK | 0.000 | 0.000 | 0.000 | 0.136 | 0.056 | 0.428 | 0.324 | 0.056 | ||
| 1 spectrum, ISMPDFDLNLK | 0.000 | 0.000 | 0.000 | 0.000 | 0.000 | 0.418 | 0.582 | 0.000 | ||
| 1 spectrum, VEAPDVEVHGPDWHLK | 0.000 | 0.000 | 0.001 | 0.000 | 0.000 | 0.613 | 0.386 | 0.000 | ||
| 2 spectra, MPDVHFK | 0.000 | 0.000 | 0.000 | 0.000 | 0.000 | 0.650 | 0.328 | 0.023 | ||
| 1 spectrum, MPDMHFK | 0.000 | 0.000 | 0.000 | 0.000 | 0.070 | 0.489 | 0.442 | 0.000 | ||
| 1 spectrum, FEGPGVSLK | 0.000 | 0.000 | 0.000 | 0.163 | 0.082 | 0.472 | 0.250 | 0.033 | ||
| 1 spectrum, VSSGQISGPEIK | 0.173 | 0.000 | 0.000 | 0.000 | 0.000 | 0.424 | 0.365 | 0.038 | ||
| 1 spectrum, VDINAPDVDVQGPDWHLK | 0.000 | 0.000 | 0.000 | 0.000 | 0.203 | 0.363 | 0.242 | 0.192 | ||
| 3 spectra, ISMPDVDLHIK | 0.000 | 0.000 | 0.000 | 0.000 | 0.027 | 0.578 | 0.354 | 0.040 | ||
| 1 spectrum, AGAISASGPELEGASHSK | 0.000 | 0.000 | 0.000 | 0.000 | 0.000 | 0.395 | 0.420 | 0.185 | ||
| 2 spectra, ISMPDLHLK | 0.000 | 0.000 | 0.000 | 0.115 | 0.215 | 0.485 | 0.119 | 0.067 | ||
| 6 spectra, ADIDVSGPK | 0.000 | 0.000 | 0.000 | 0.000 | 0.000 | 0.752 | 0.248 | 0.000 | ||
| 1 spectrum, VSGPDLDLNLK | 0.000 | 0.000 | 0.000 | 0.000 | 0.202 | 0.438 | 0.066 | 0.294 | ||
| 1 spectrum, FTFSGR | 0.000 | 0.000 | 0.000 | 0.000 | 0.133 | 0.592 | 0.148 | 0.127 | ||
| 2 spectra, VDINAPEVEVQGK | 0.000 | 0.000 | 0.000 | 0.000 | 0.054 | 0.666 | 0.161 | 0.119 | ||
| 1 spectrum, MDIDTPDIDIHGPEGK | 0.000 | 0.000 | 0.000 | 0.000 | 0.000 | 0.653 | 0.347 | 0.000 | ||
| 1 spectrum, GGVTGSPEASVSGSK | 0.000 | 0.000 | 0.000 | 0.000 | 0.000 | 0.706 | 0.186 | 0.109 | ||
| 4 spectra, VEGDLEGPHVDIK | 0.000 | 0.000 | 0.000 | 0.000 | 0.009 | 0.631 | 0.210 | 0.149 | ||
| 1 spectrum, GDVDVSLPK | 0.000 | 0.000 | 0.000 | 0.000 | 0.213 | 0.554 | 0.233 | 0.000 | ||
| 2 spectra, FSMPGFK | 0.000 | 0.000 | 0.000 | 0.000 | 0.000 | 0.575 | 0.425 | 0.000 | ||
| 2 spectra, LDVNAPDIDIHGPEGK | 0.000 | 0.000 | 0.000 | 0.000 | 0.046 | 0.619 | 0.217 | 0.118 | ||
| 3 spectra, VEGEIK | 0.000 | 0.000 | 0.000 | 0.000 | 0.000 | 0.650 | 0.323 | 0.028 |
| Plot | Mito | Lyso or Perox | ER | Golgi | PM | Cytosol | Nucleus | ||||||
| Expt B |
2 peptides |
2 spectra |
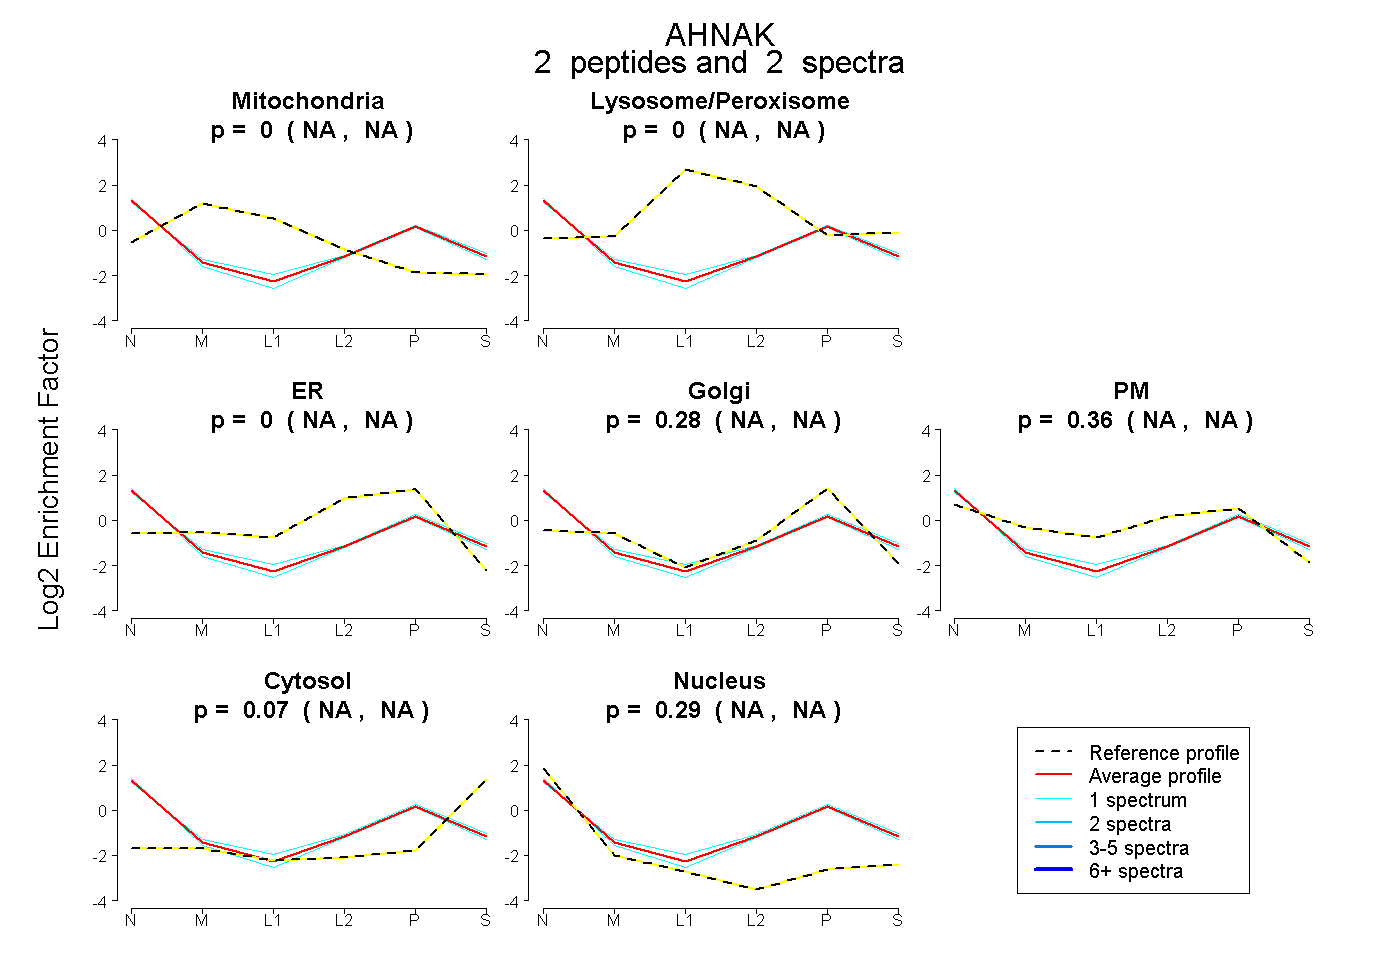 |
0.000 NA | NA |
0.000 NA | NA |
0.000 NA | NA |
0.279 NA | NA |
0.362 NA | NA |
0.072 NA | NA |
0.287 NA | NA |
|||
| Plot | Lyso | Other | |||||||||||
| Expt C |
11 peptides |
22 spectra |
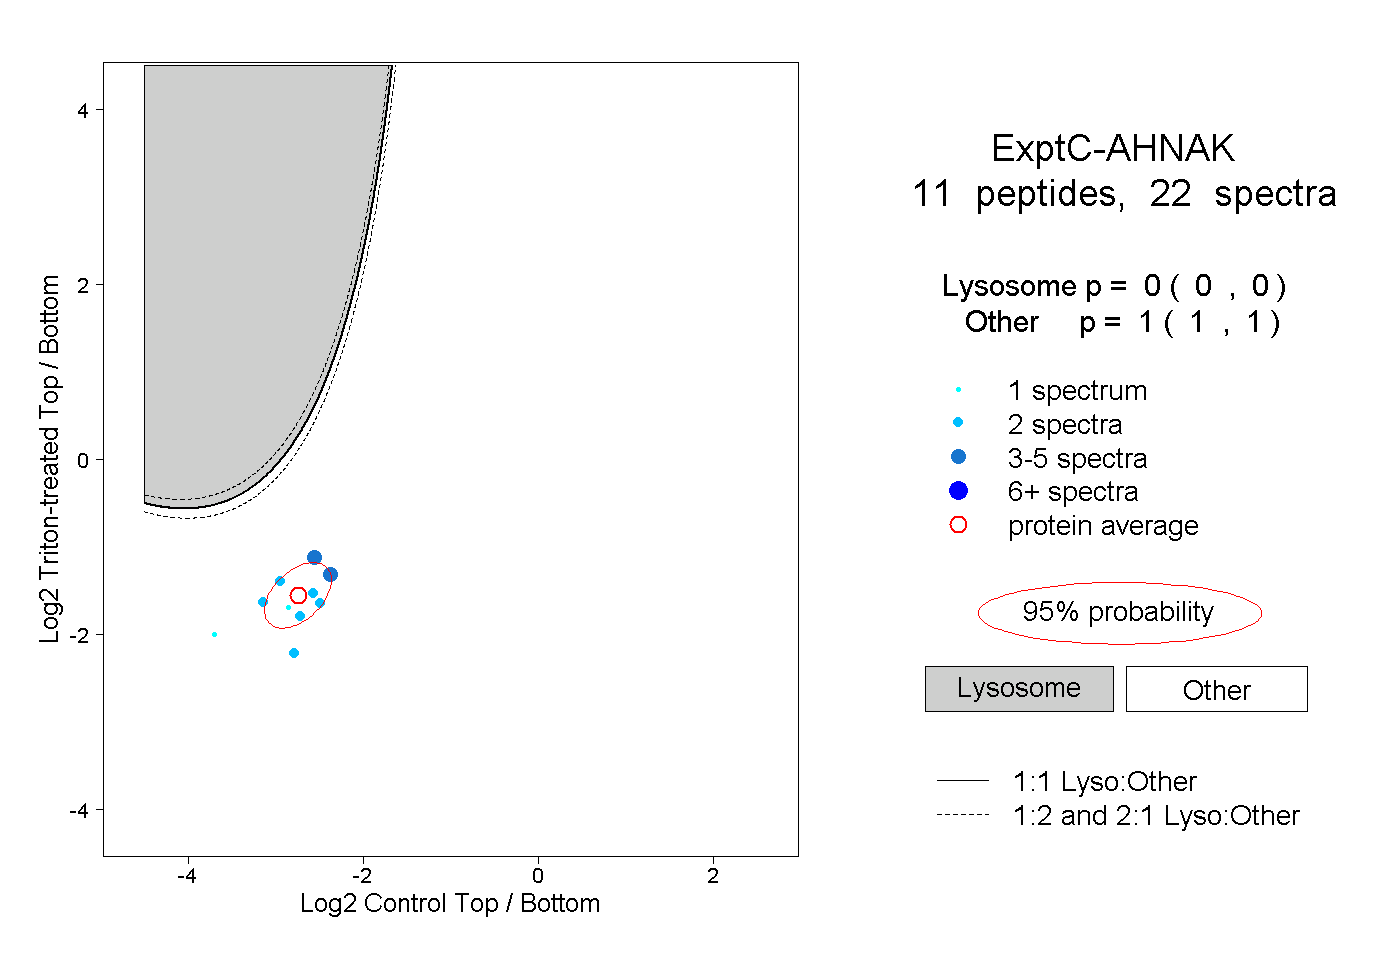 |
0.000 0.000 | 0.000 |
1.000 1.000 | 1.000 |
||||||||
| Plot | Lyso | Other | |||||||||||
| Expt D |
1 peptide |
1 spectrum |
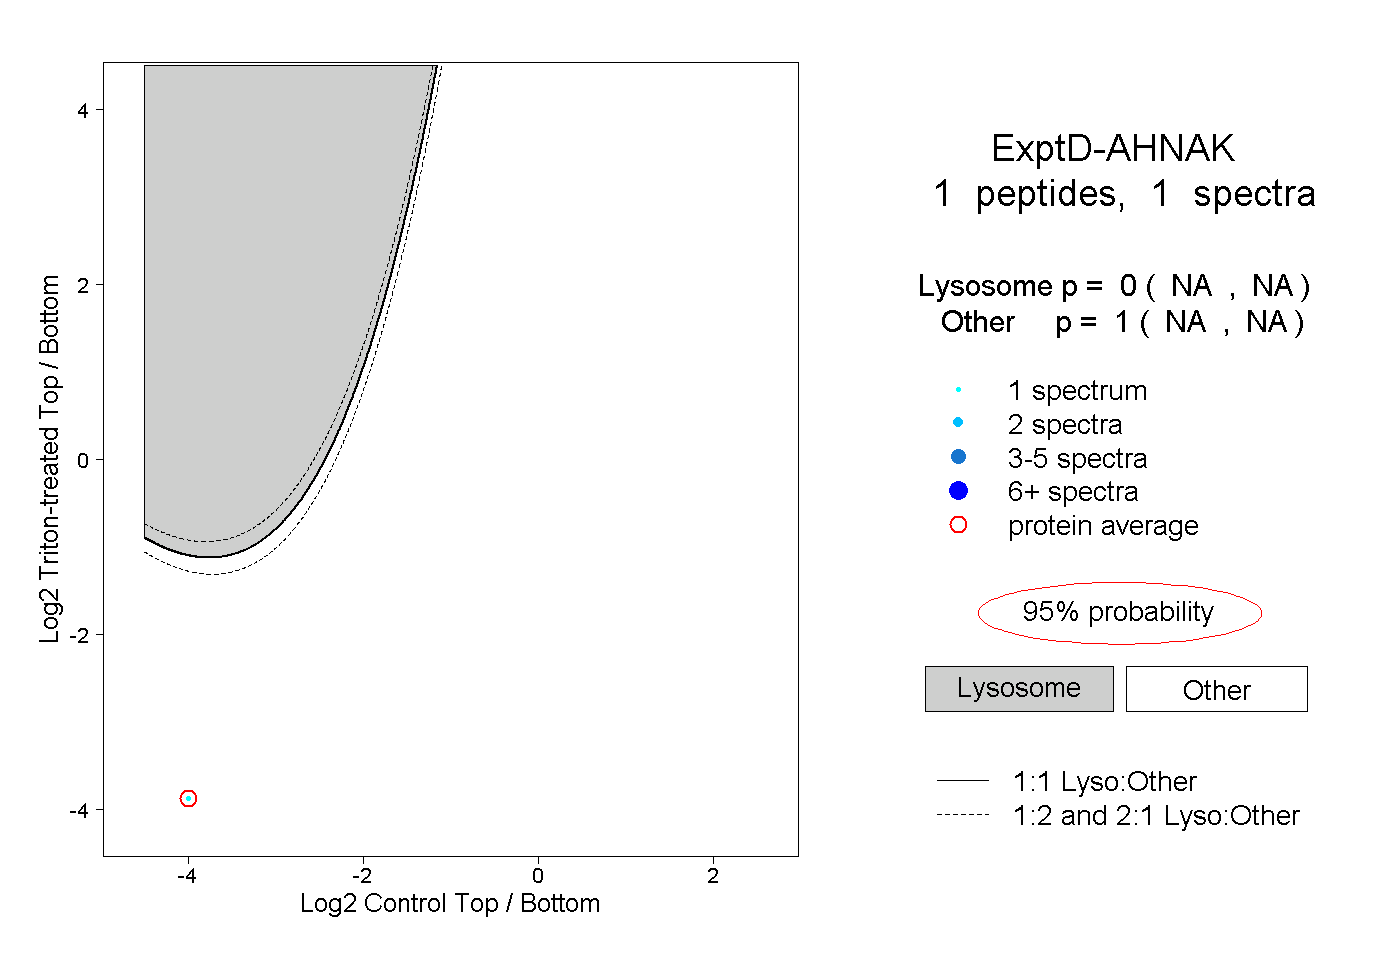 |
0.000 NA | NA |
1.000 NA | NA |