 4
4peptides
spectra
0.000 | 0.085
0.000 | 0.000
0.000 | 0.006
0.000 | 0.219
0.000 | 0.238
0.000 | 0.000
0.048 | 0.217
0.566 | 0.714
2peptides
spectra
0.000 | 0.000
1.000 | 1.000
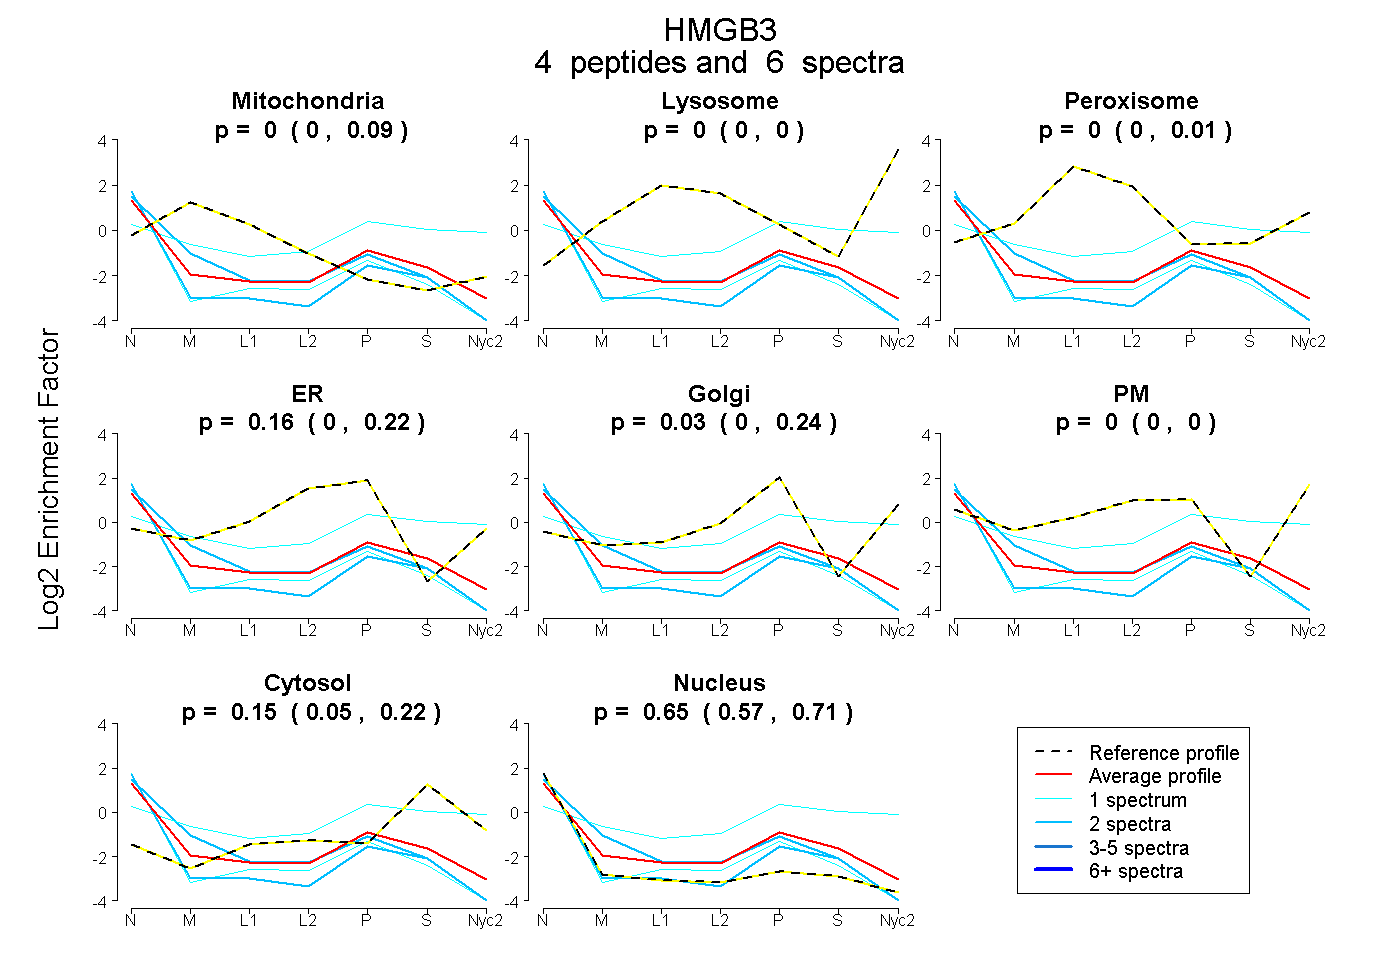
| Plot | Mito | Lyso | Perox | ER | Golgi | PM | Cytosol | Nucleus | |||||
| Expt A |
4 peptides |
6 spectra |
|
0.000 0.000 | 0.085 |
0.000 0.000 | 0.000 |
0.000 0.000 | 0.006 |
0.163 0.000 | 0.219 |
0.034 0.000 | 0.238 |
0.000 0.000 | 0.000 |
0.150 0.048 | 0.217 |
0.653 0.566 | 0.714 |
||
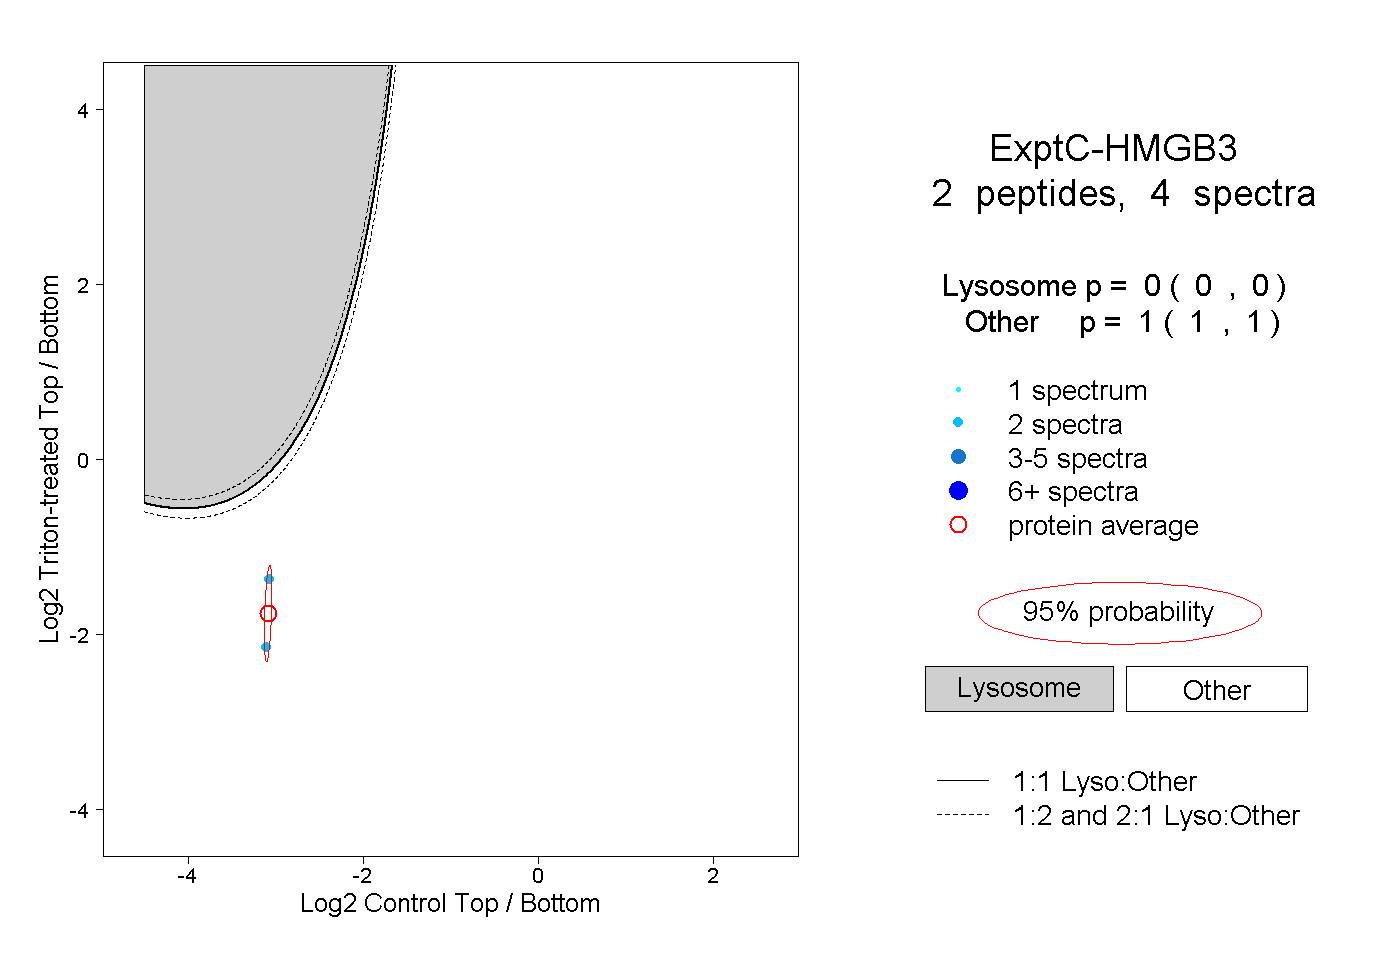
| Plot | Lyso | Other | |||||||||||
| Expt C |
2 peptides |
4 spectra |
|
0.000 0.000 | 0.000 |
1.000 1.000 | 1.000 |