 2
2peptides
spectra
0.000 | 0.076
0.146 | 0.392
0.000 | 0.103
0.000 | 0.000
0.000 | 0.000
0.470 | 0.781
0.000 | 0.039
0.000 | 0.094
3peptides
spectra
0.000 | 0.000
1.000 | 1.000
| Plot | Mito | Lyso | Perox | ER | Golgi | PM | Cytosol | Nucleus | |||||
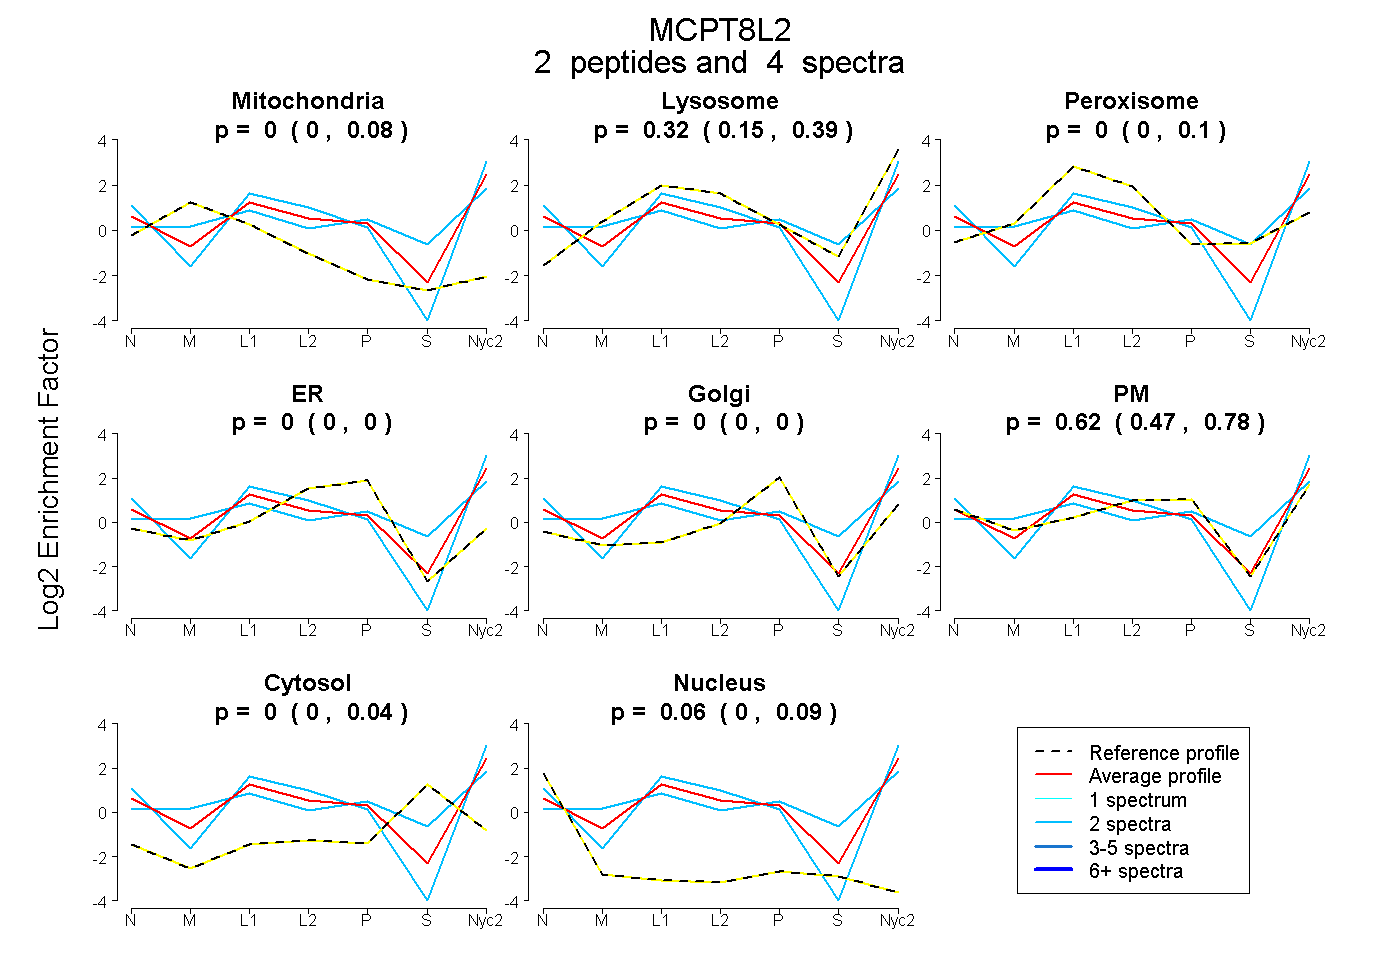
| Expt A |
2 peptides |
4 spectra |
|
0.000 0.000 | 0.076 |
0.317 0.146 | 0.392 |
0.000 0.000 | 0.103 |
0.000 0.000 | 0.000 |
0.000 0.000 | 0.000 |
0.624 0.470 | 0.781 |
0.000 0.000 | 0.039 |
0.058 0.000 | 0.094 |
||
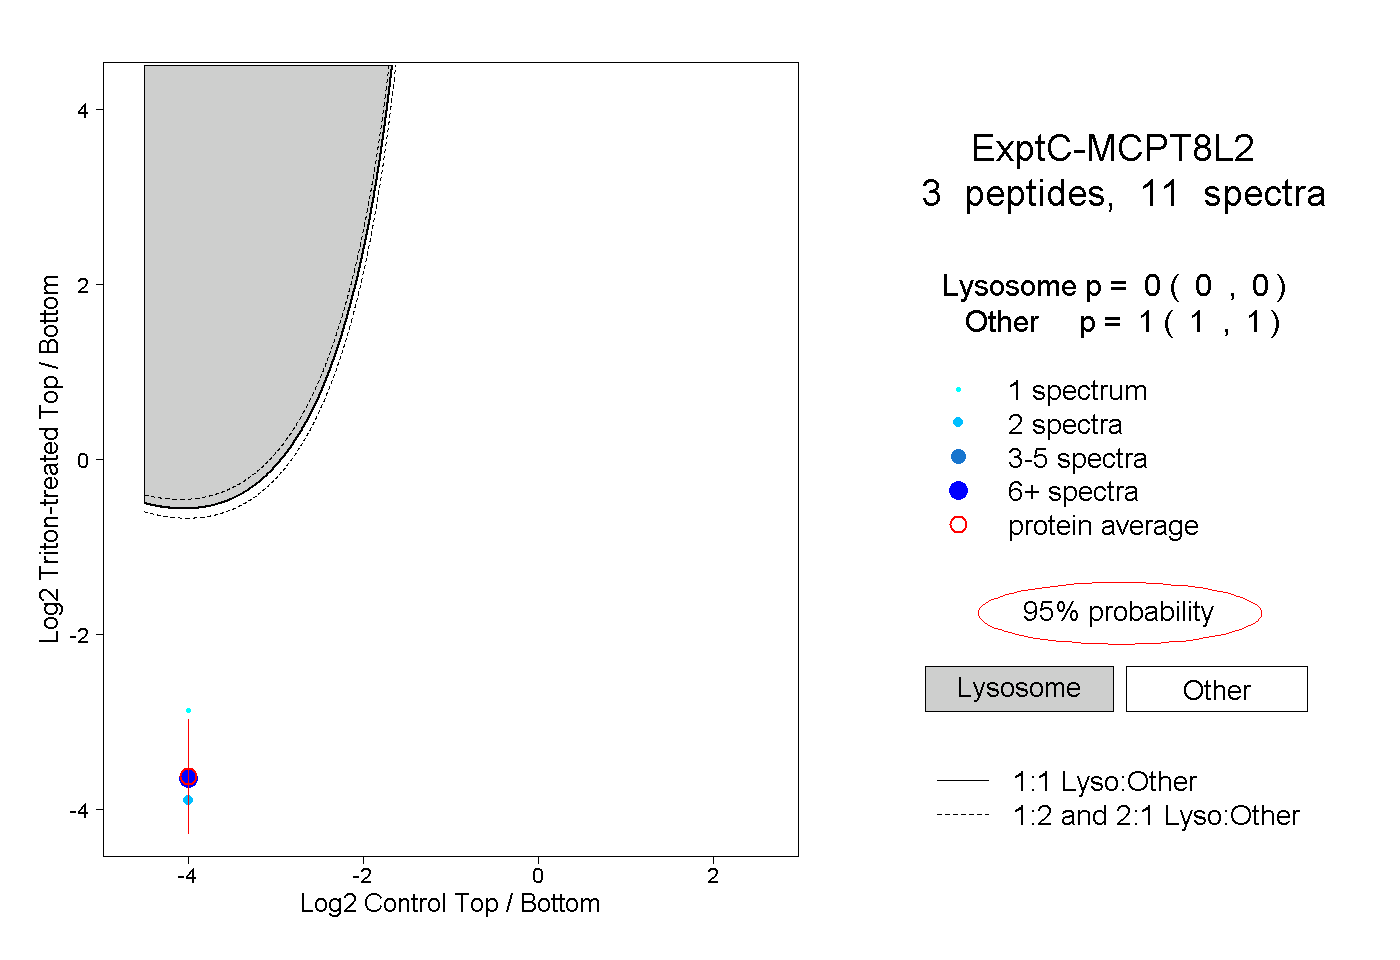
| Plot | Lyso | Other | |||||||||||
| Expt C |
3 peptides |
11 spectra |
|
0.000 0.000 | 0.000 |
1.000 1.000 | 1.000 |
| 1 spectrum, VTLGAHNIR | 0.000 | 1.000 | ||||||||
| 8 spectra, AKPHENYDK | 0.000 | 1.000 | ||||||||
| 2 spectra, ENTQVISVVK | 0.000 | 1.000 |