 1
1peptide
spectra
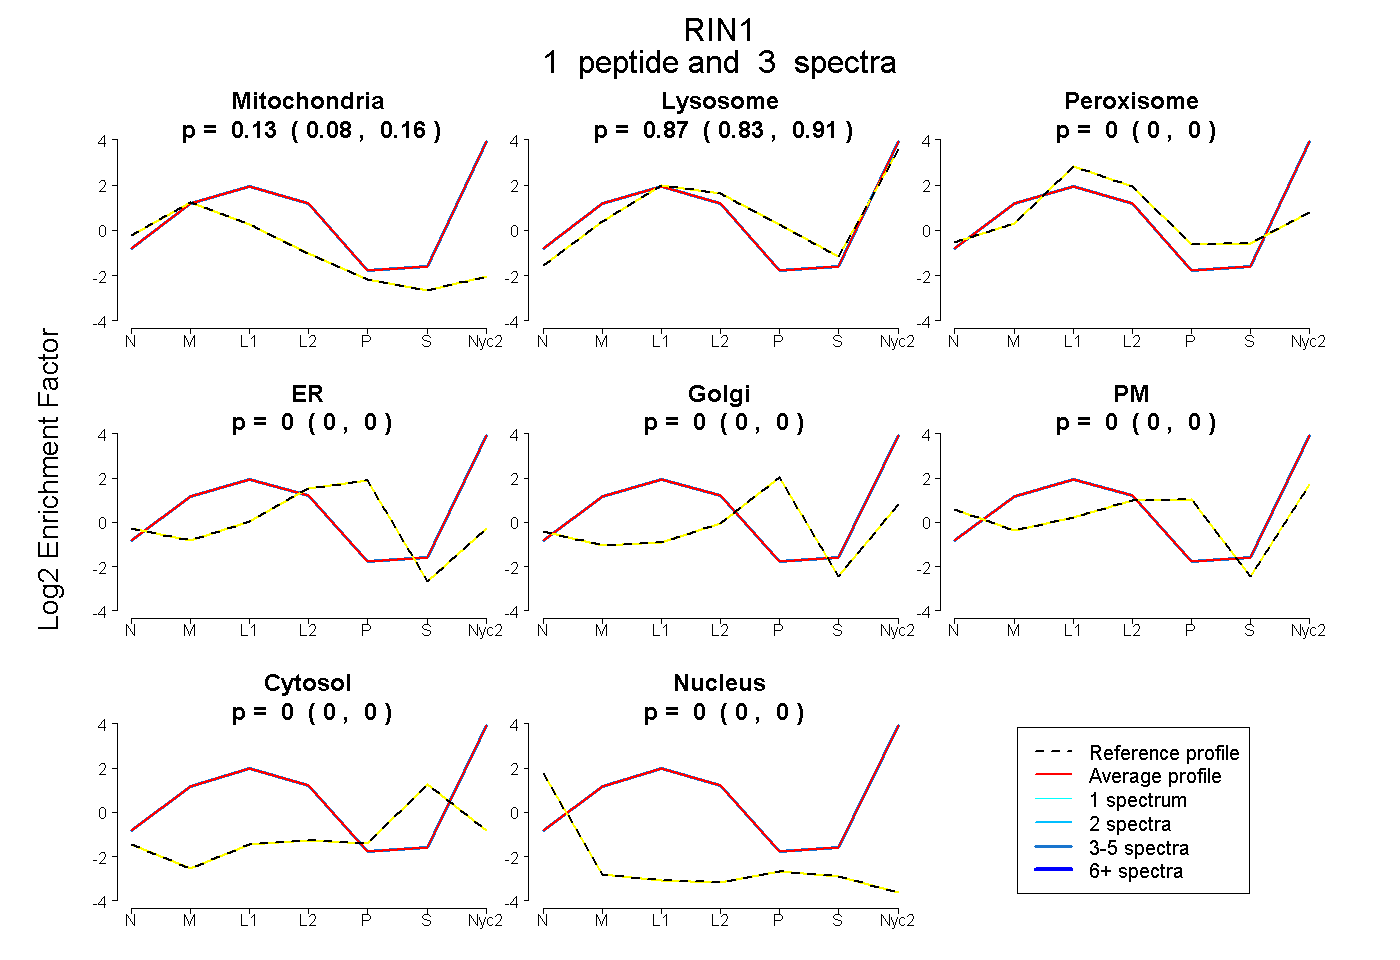
0.084 | 0.162
0.831 | 0.907
0.000 | 0.000
0.000 | 0.000
0.000 | 0.000
0.000 | 0.000
0.000 | 0.000
0.000 | 0.000
1peptide
spectra
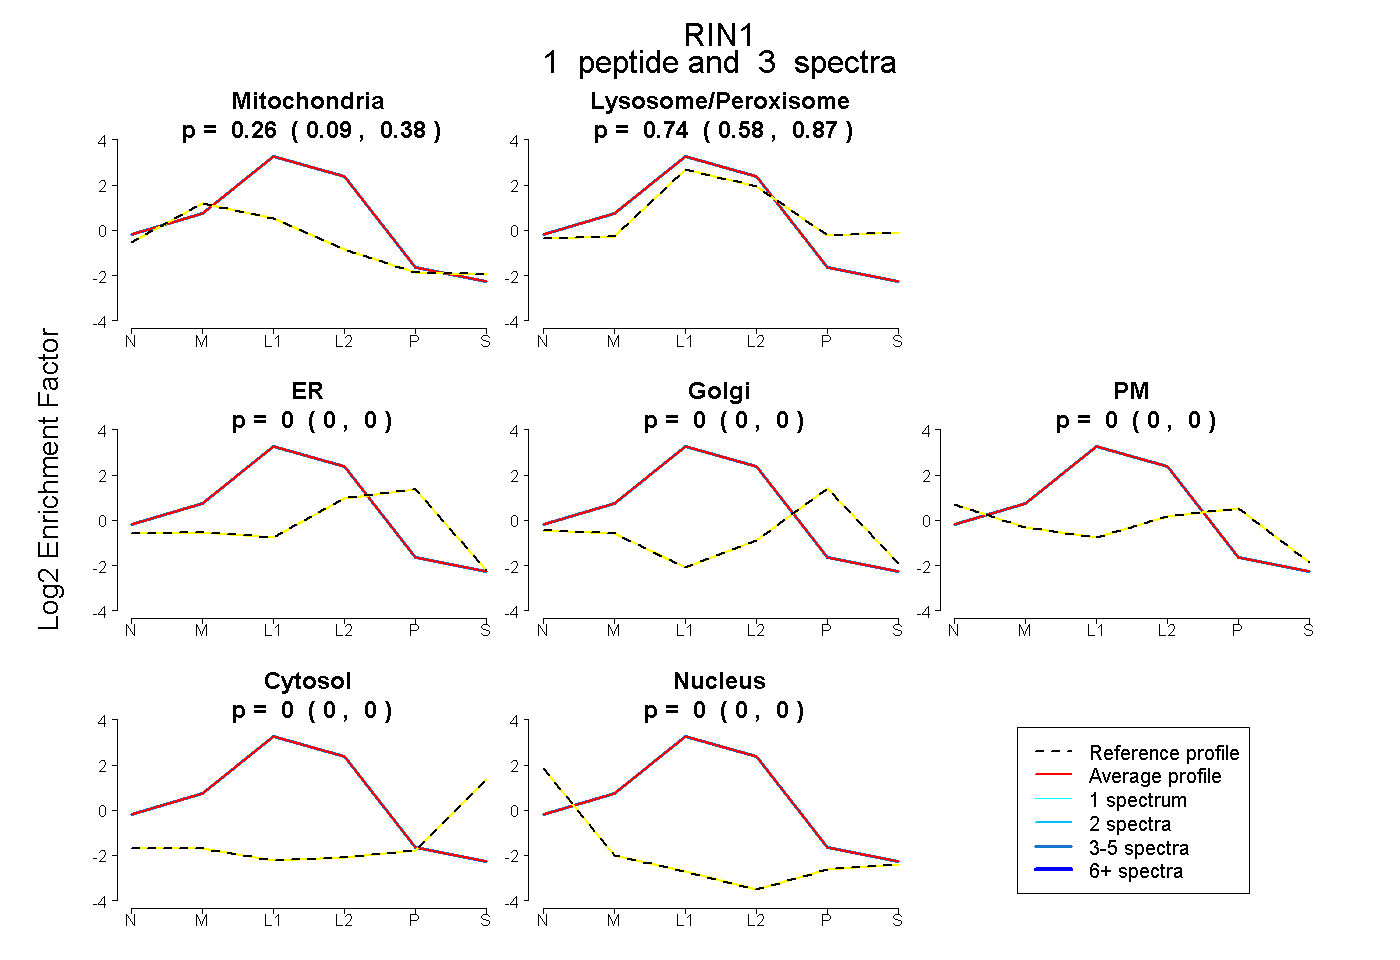
0.093 | 0.383
0.582 | 0.869
0.000 | 0.000
0.000 | 0.000
0.000 | 0.000
0.000 | 0.000
0.000 | 0.000
1peptide
spectra
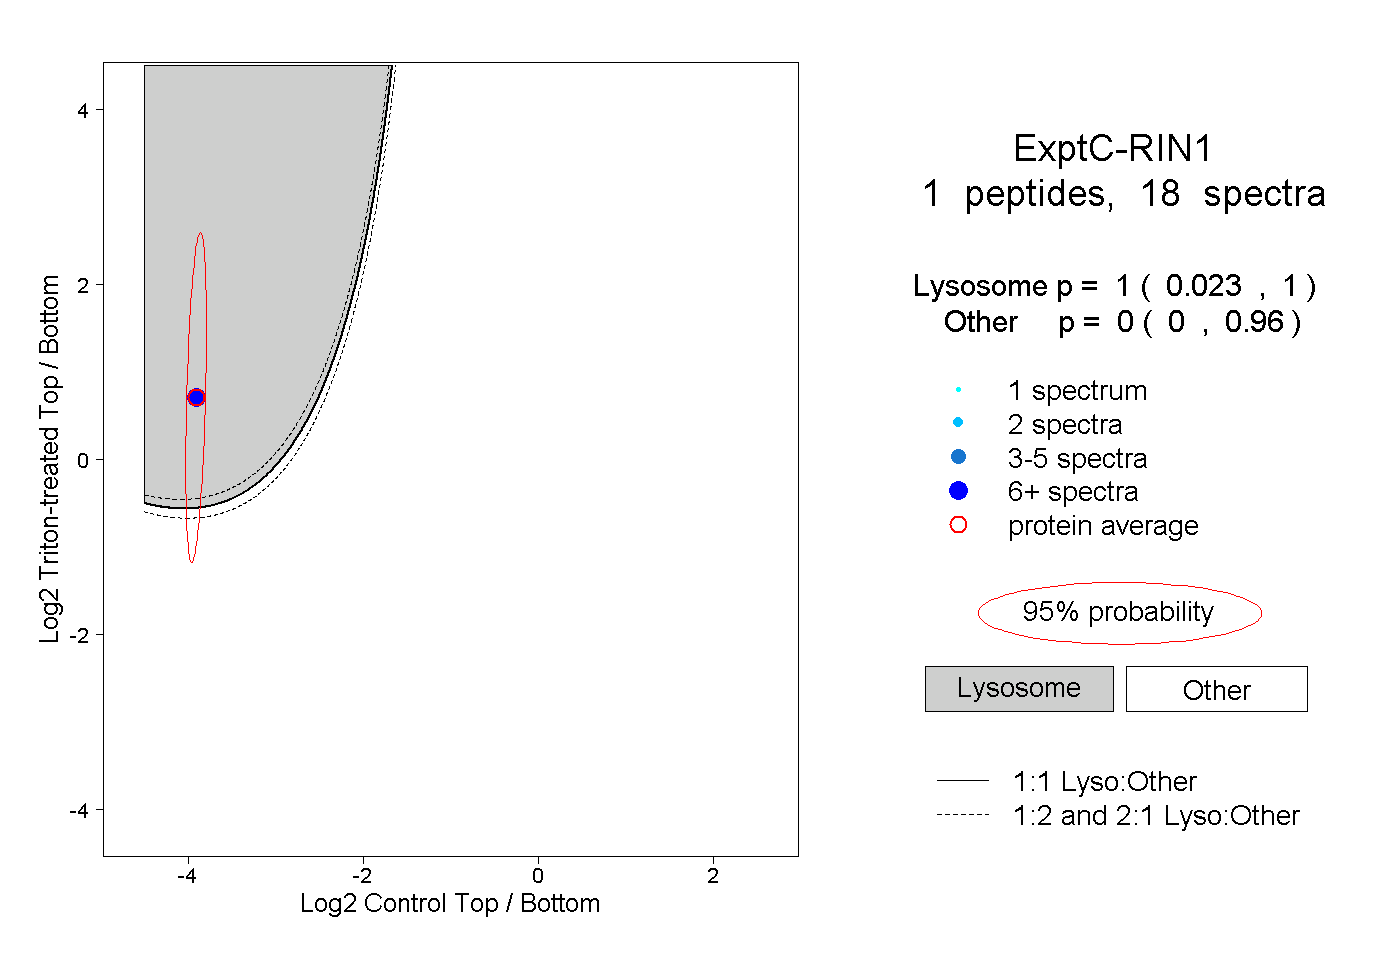
0.023 | 1.000
0.000 | 0.960
1peptide
spectra
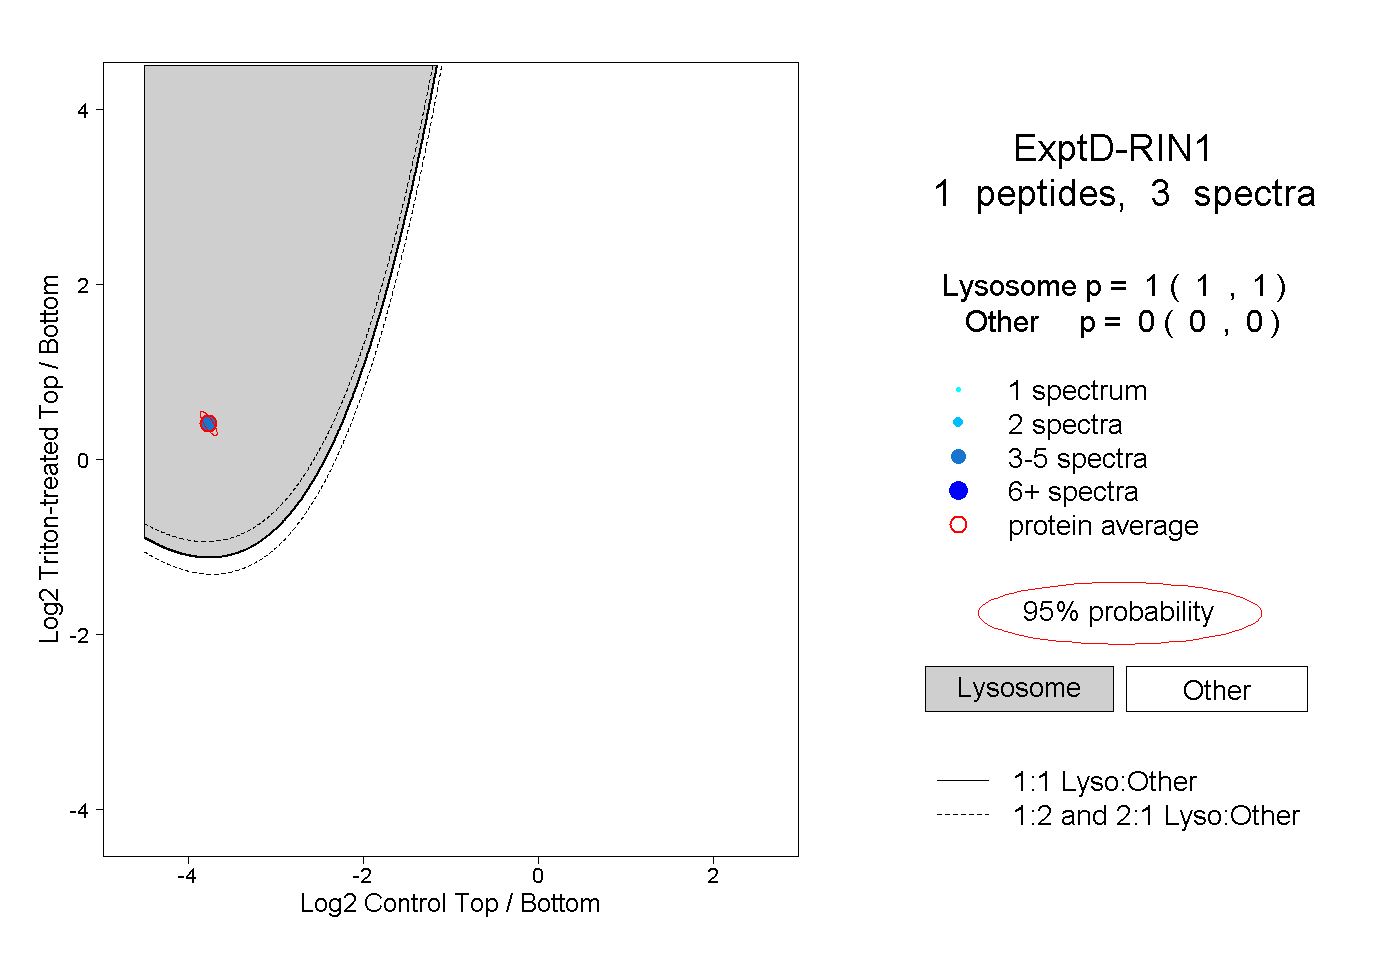
1.000 | 1.000
0.000 | 0.000