 2
2peptides
spectra
0.000 | 0.007
0.000 | 0.069
0.000 | 0.028
0.000 | 0.092
0.523 | 0.643
0.231 | 0.434
0.000 | 0.000
0.000 | 0.000
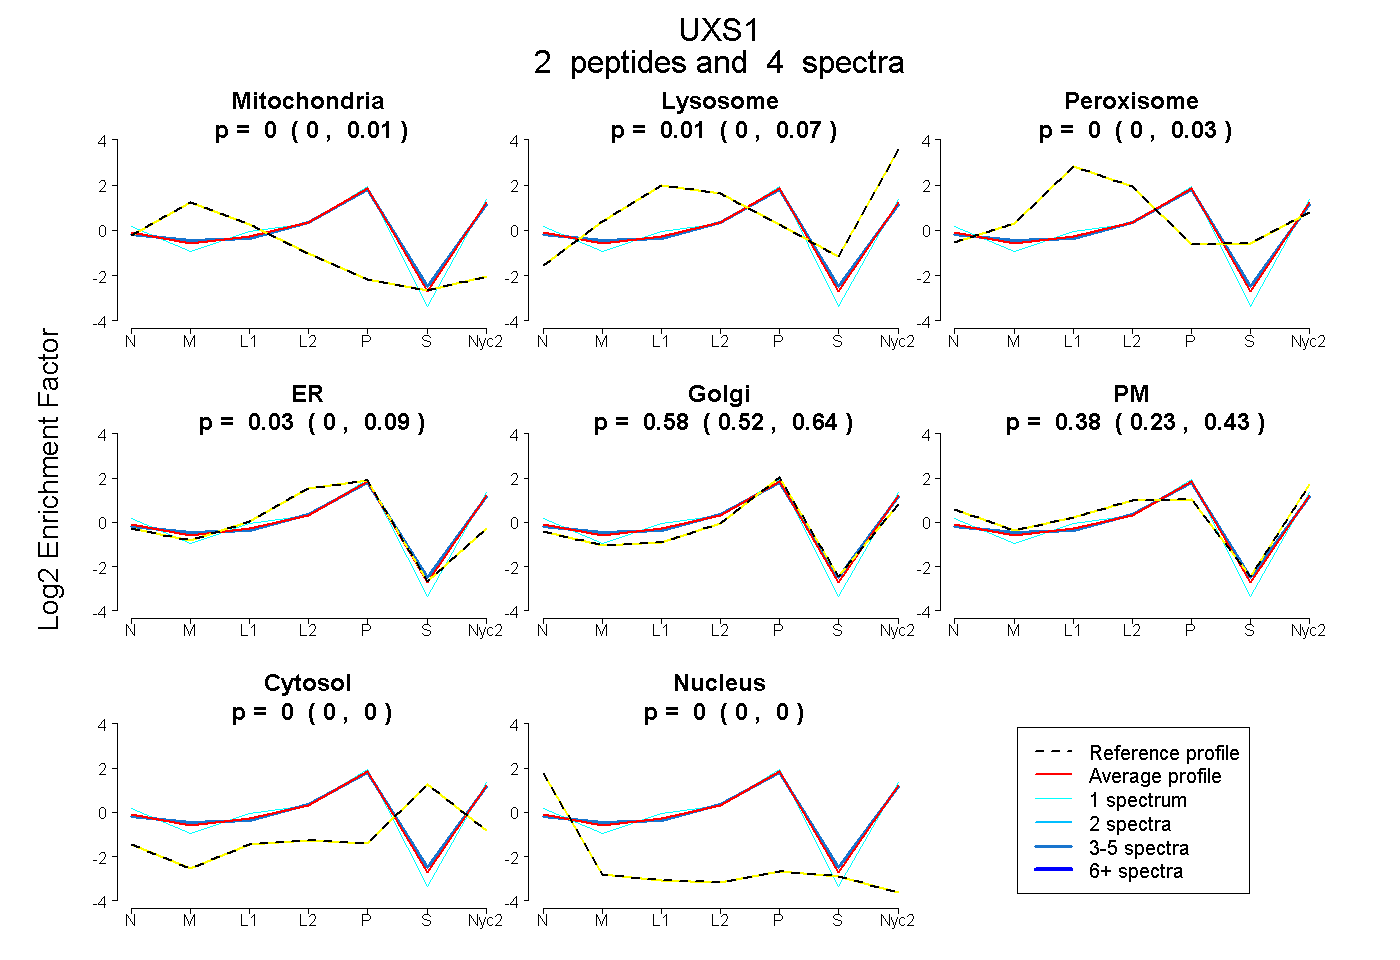
| Plot | Mito | Lyso | Perox | ER | Golgi | PM | Cytosol | Nucleus | |||||
| Expt A |
2 peptides |
4 spectra |
|
0.000 0.000 | 0.007 |
0.014 0.000 | 0.069 |
0.000 0.000 | 0.028 |
0.031 0.000 | 0.092 |
0.576 0.523 | 0.643 |
0.379 0.231 | 0.434 |
0.000 0.000 | 0.000 |
0.000 0.000 | 0.000 |
| 1 spectrum, AIHYFR | 0.000 | 0.000 | 0.000 | 0.026 | 0.517 | 0.458 | 0.000 | 0.000 | ||
| 3 spectra, IFNTFGPR | 0.008 | 0.054 | 0.000 | 0.036 | 0.613 | 0.290 | 0.000 | 0.000 |