 22
22peptides
spectra
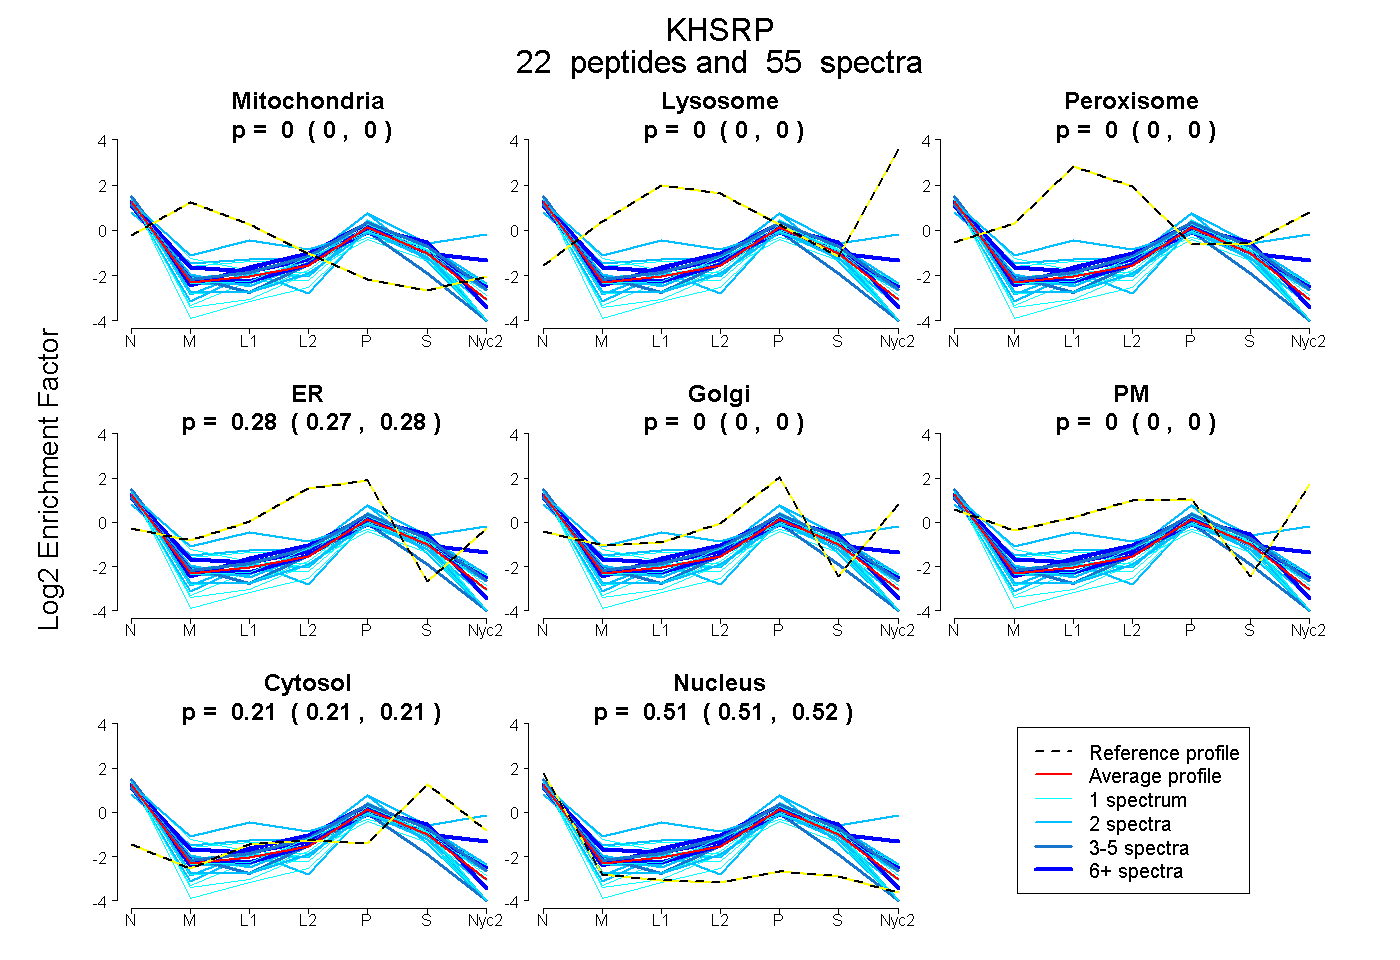
0.000 | 0.000
0.000 | 0.000
0.000 | 0.000
0.273 | 0.281
0.000 | 0.000
0.000 | 0.000
0.205 | 0.214
0.508 | 0.517
7peptides
spectra
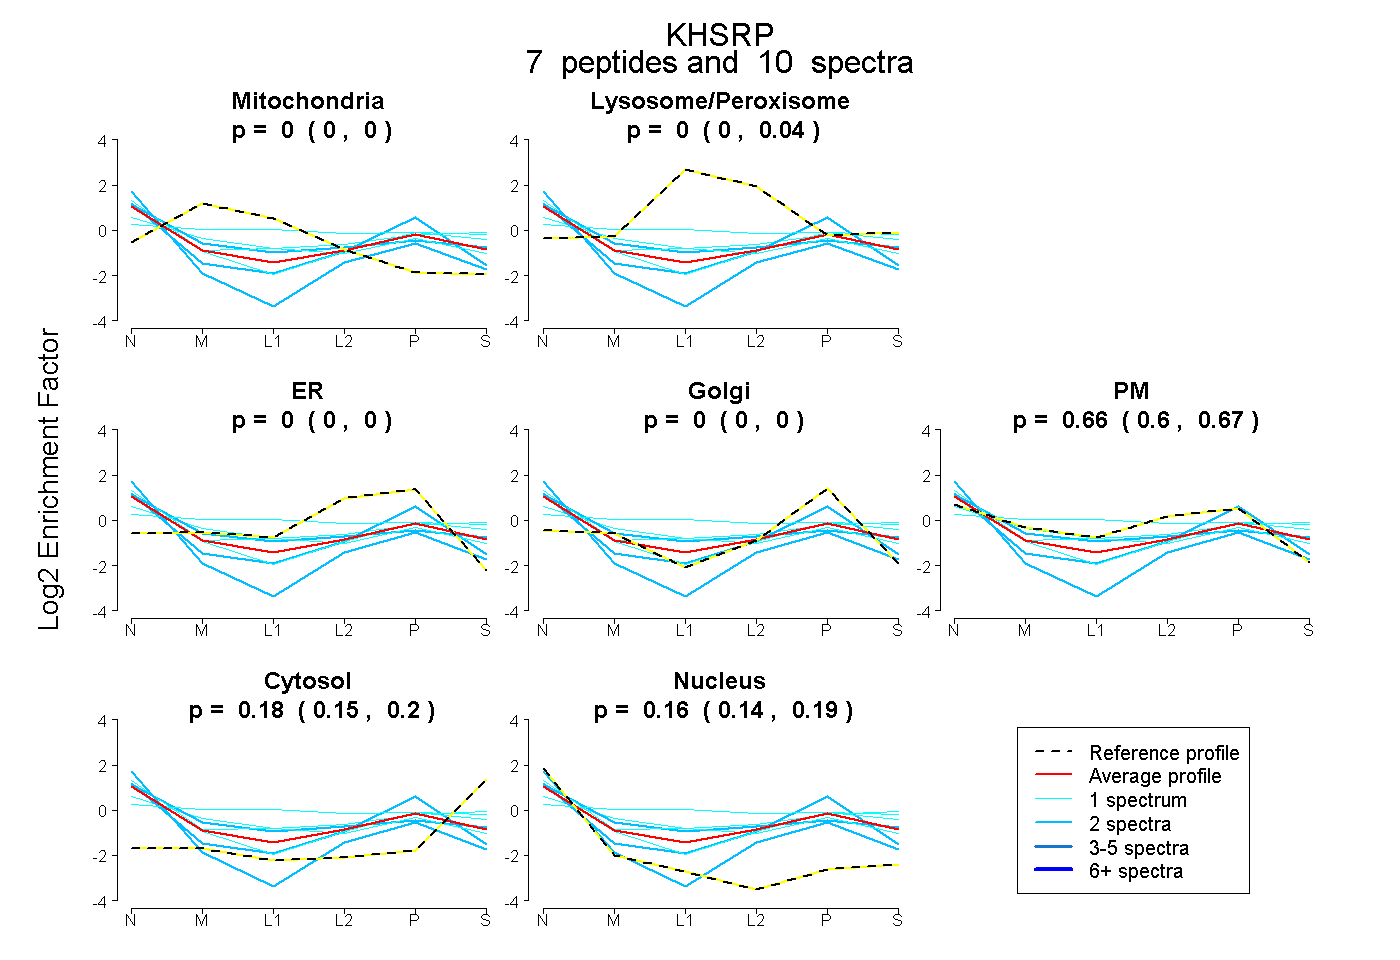
0.000 | 0.000
0.000 | 0.045
0.000 | 0.000
0.000 | 0.000
0.596 | 0.673
0.146 | 0.203
0.140 | 0.189
11peptides
spectra
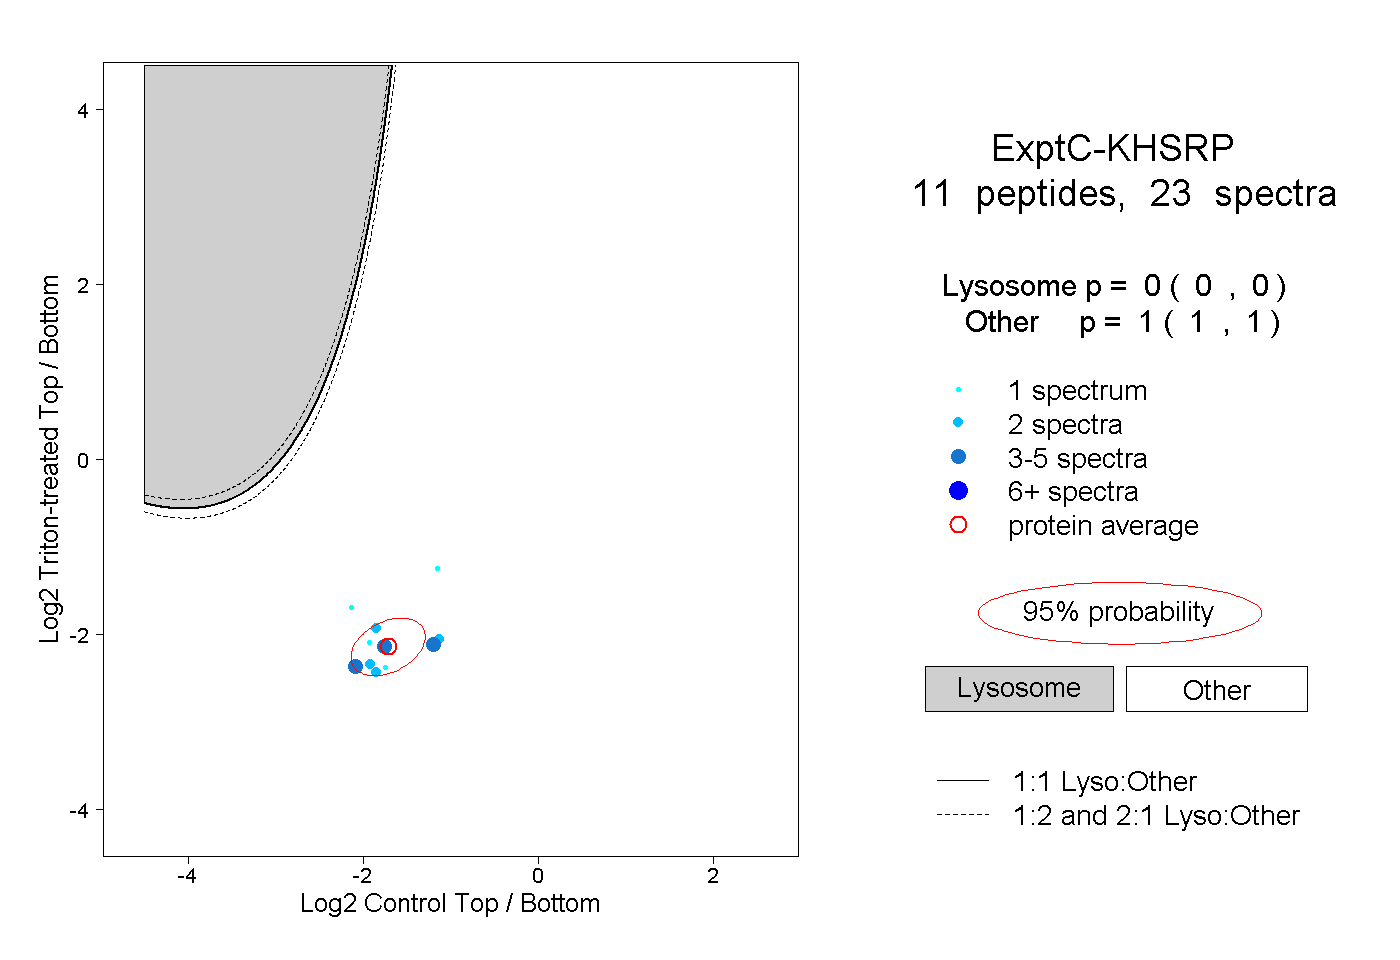
0.000 | 0.000
1.000 | 1.000
3peptides
spectra
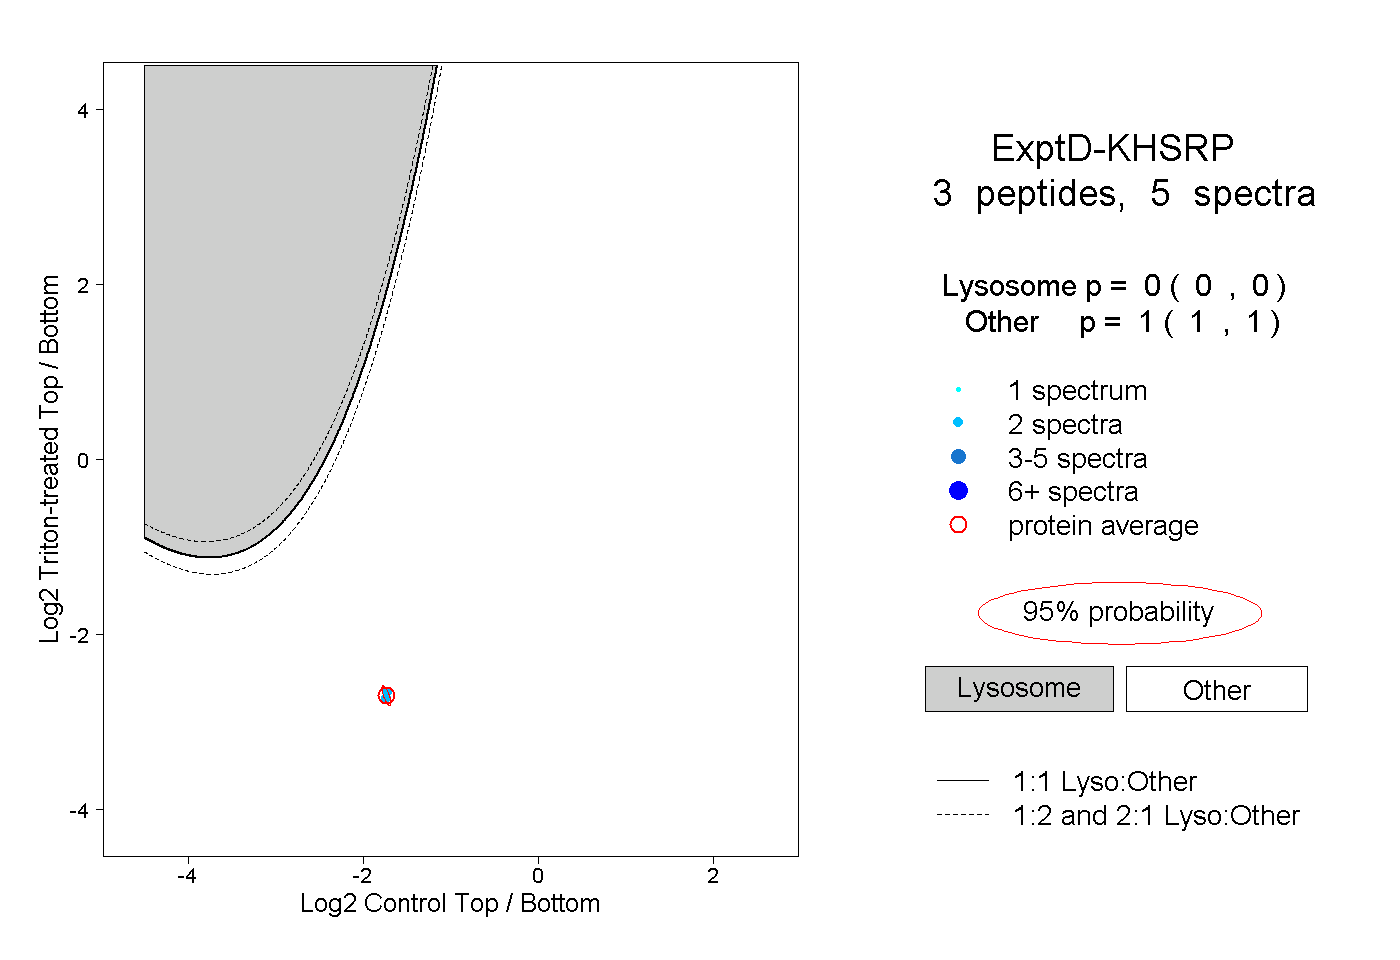
0.000 | 0.000
1.000 | 1.000