 9
9peptides
spectra

0.000 | 0.000
0.000 | 0.000
0.000 | 0.000
0.000 | 0.000
0.000 | 0.000
0.000 | 0.000
0.000 | 0.000
1.000 | 1.000
3peptides
spectra
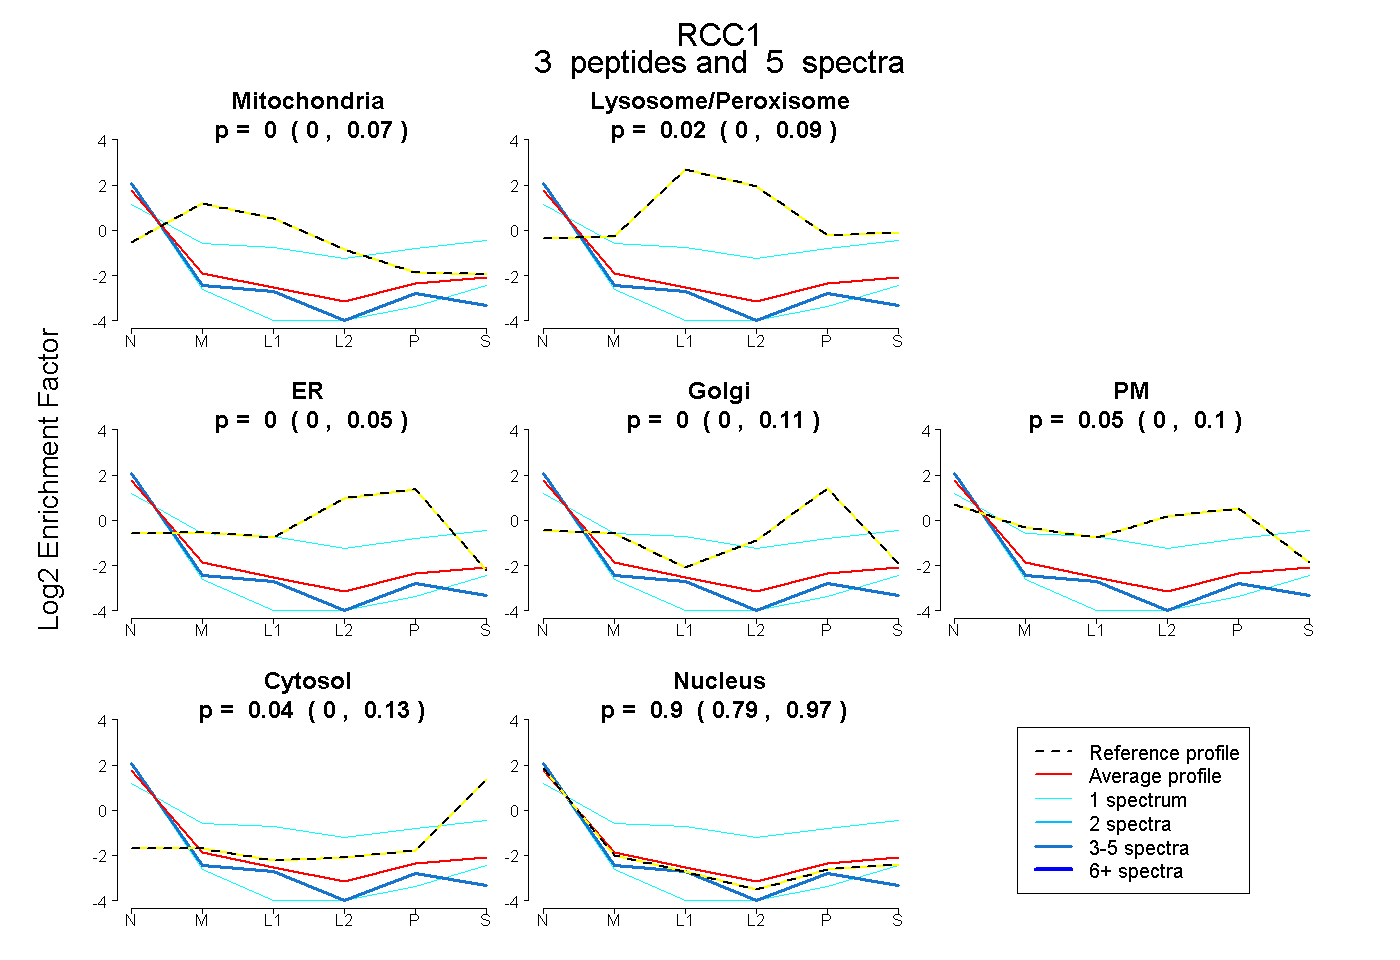
0.000 | 0.071
0.000 | 0.091
0.000 | 0.052
0.000 | 0.108
0.000 | 0.099
0.000 | 0.132
0.788 | 0.966