 3
3peptides
spectra
0.000 | 0.034
0.000 | 0.000
0.000 | 0.000
0.000 | 0.000
0.155 | 0.293
0.259 | 0.383
0.198 | 0.247
0.184 | 0.229
2peptides
spectra
0.000 | 0.000
1.000 | 1.000
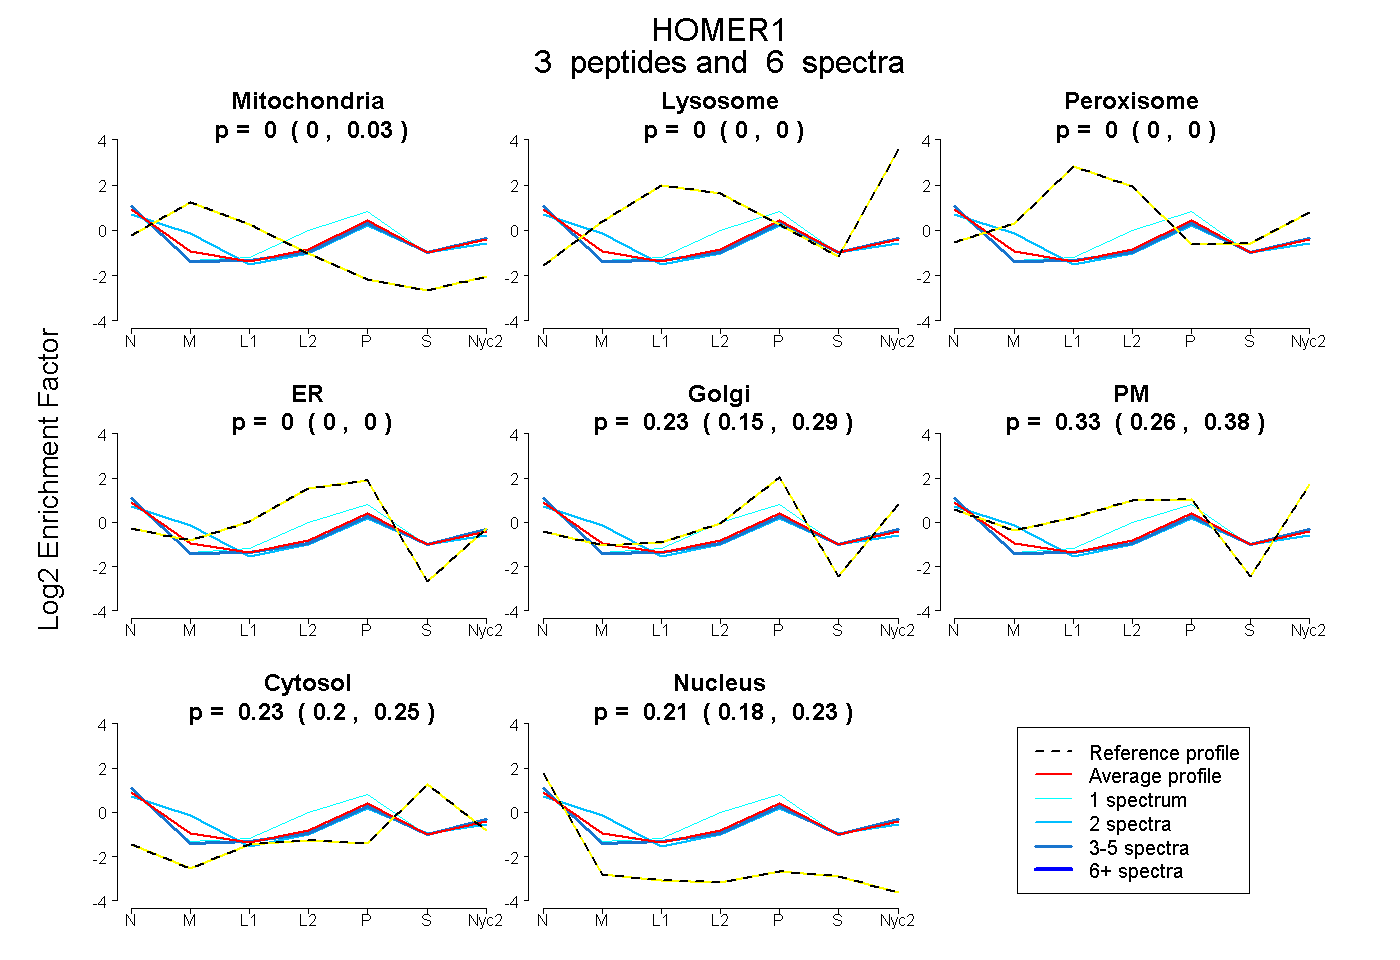
| Plot | Mito | Lyso | Perox | ER | Golgi | PM | Cytosol | Nucleus | |||||
| Expt A |
3 peptides |
6 spectra |
|
0.000 0.000 | 0.034 |
0.000 0.000 | 0.000 |
0.000 0.000 | 0.000 |
0.000 0.000 | 0.000 |
0.229 0.155 | 0.293 |
0.332 0.259 | 0.383 |
0.226 0.198 | 0.247 |
0.214 0.184 | 0.229 |
||
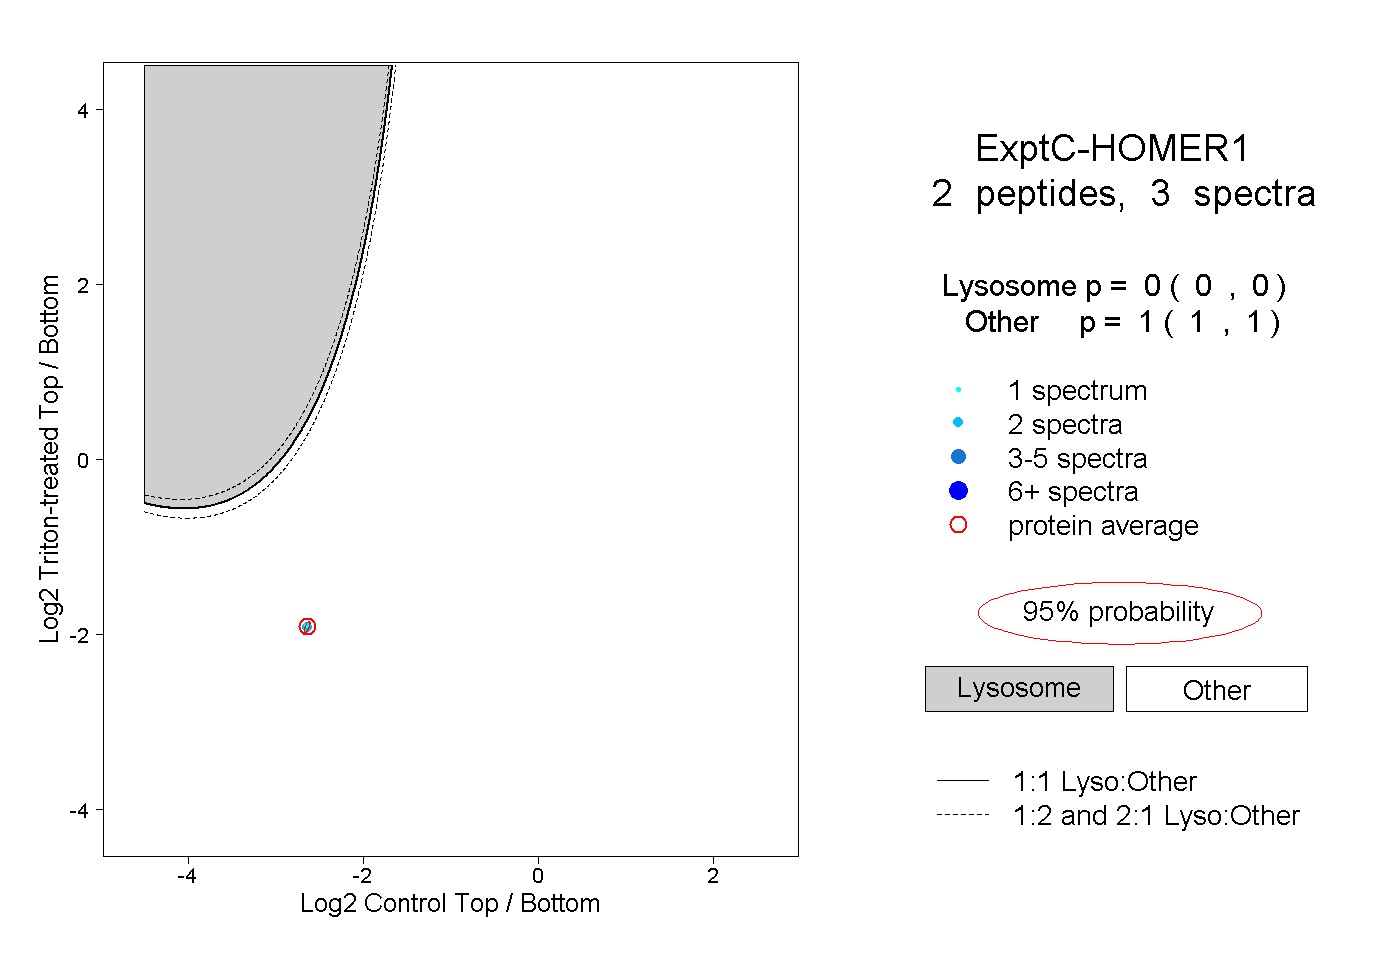
| Plot | Lyso | Other | |||||||||||
| Expt C |
2 peptides |
3 spectra |
|
0.000 0.000 | 0.000 |
1.000 1.000 | 1.000 |