 7
7peptides
spectra
0.000 | 0.000
0.147 | 0.194
0.000 | 0.000
0.000 | 0.000
0.000 | 0.054
0.000 | 0.075
0.754 | 0.781
0.000 | 0.000
9peptides
spectra
0.003 | 0.744
0.256 | 0.997
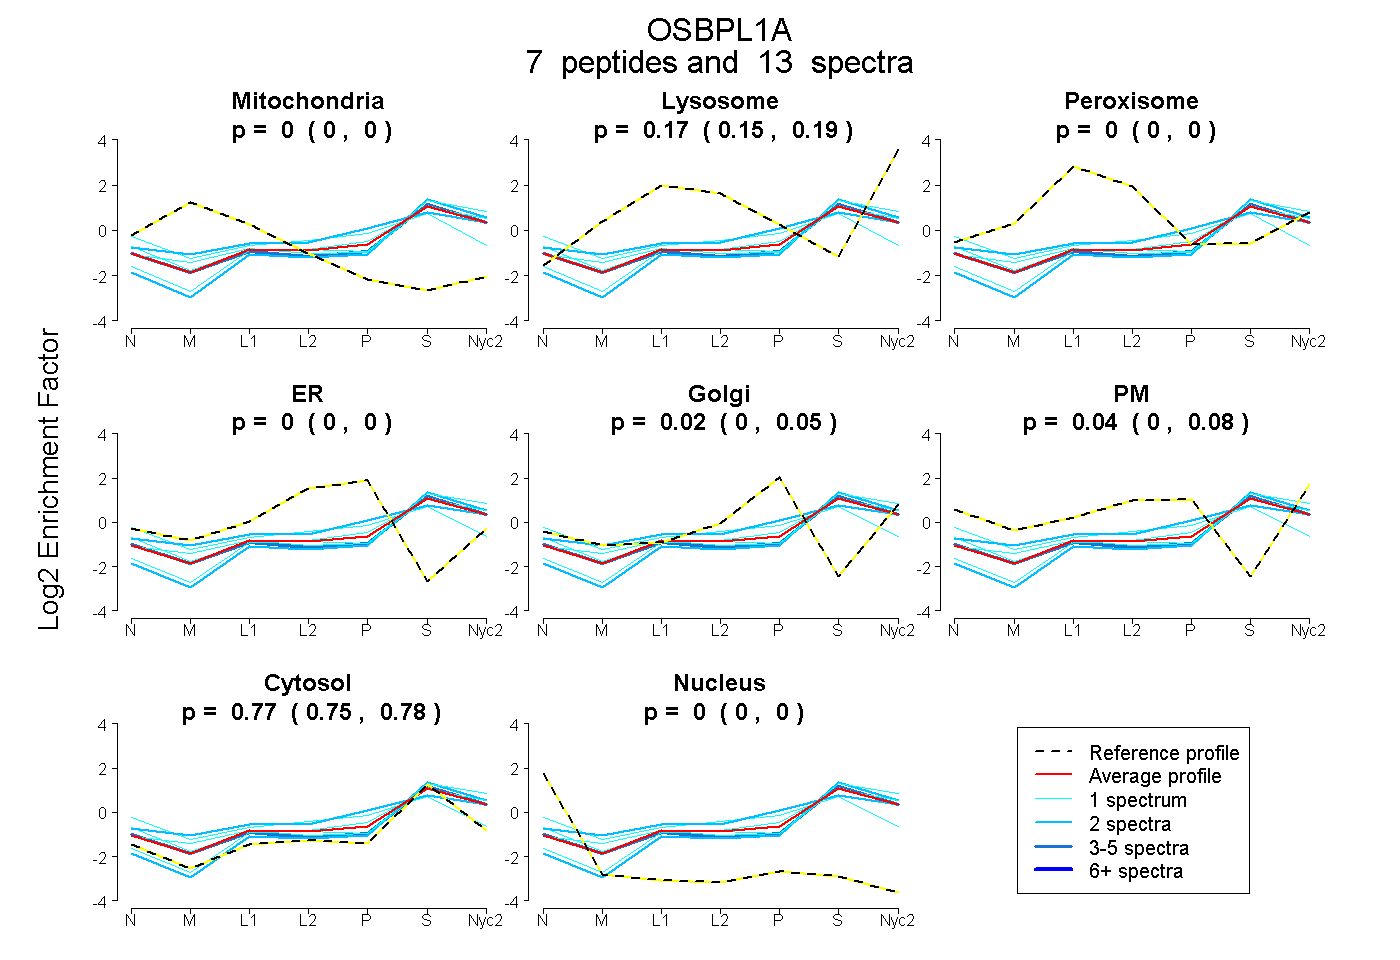
| Plot | Mito | Lyso | Perox | ER | Golgi | PM | Cytosol | Nucleus | |||||
| Expt A |
7 peptides |
13 spectra |
|
0.000 0.000 | 0.000 |
0.172 0.147 | 0.194 |
0.000 0.000 | 0.000 |
0.000 0.000 | 0.000 |
0.018 0.000 | 0.054 |
0.040 0.000 | 0.075 |
0.770 0.754 | 0.781 |
0.000 0.000 | 0.000 |
||
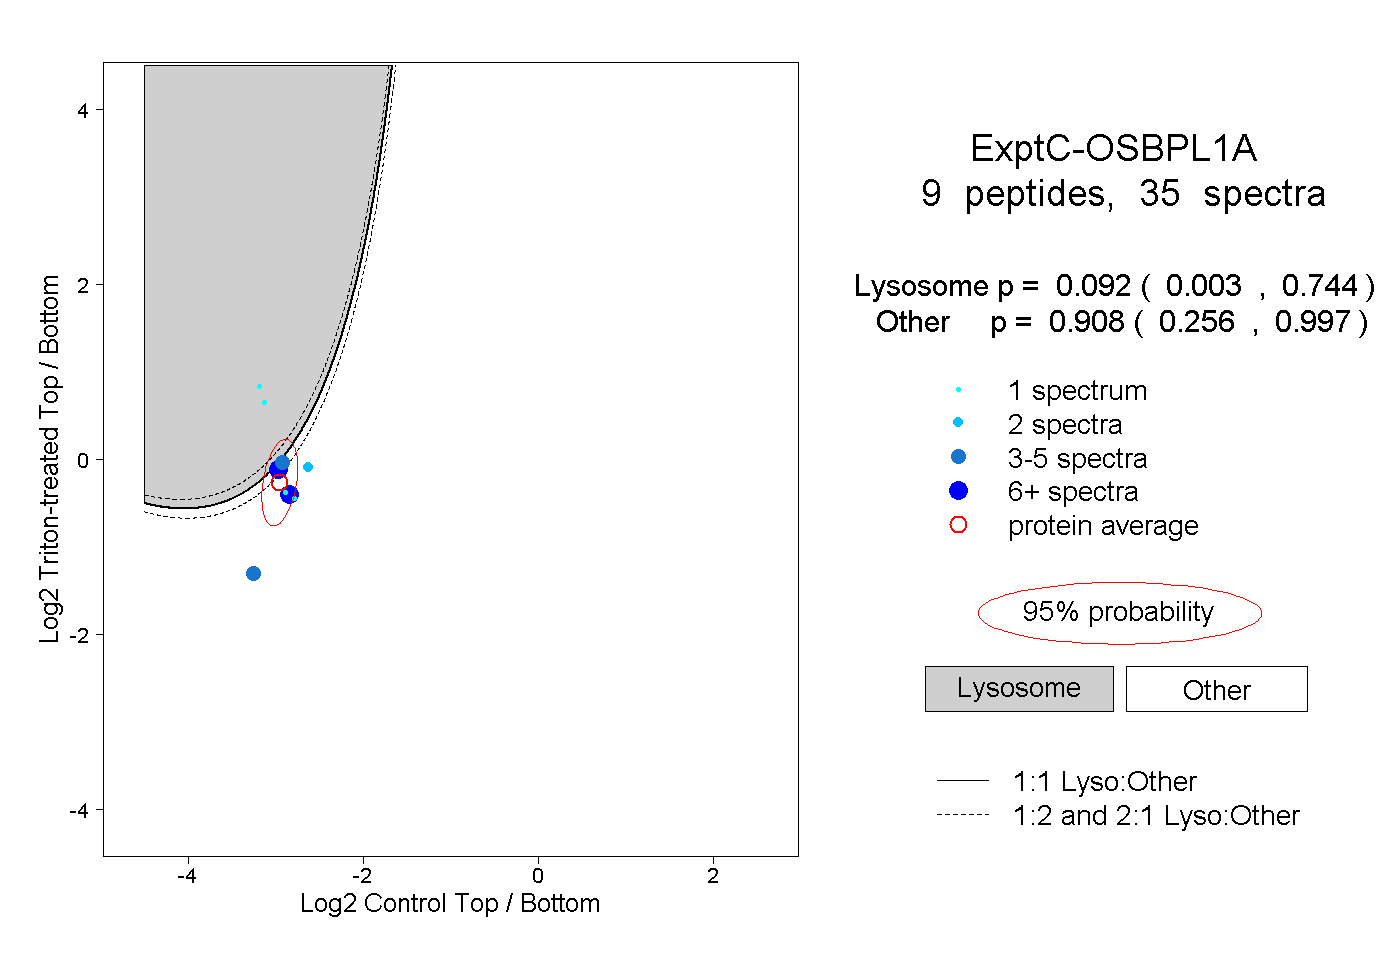
| Plot | Lyso | Other | |||||||||||
| Expt C |
9 peptides |
35 spectra |
|
0.092 0.003 | 0.744 |
0.908 0.256 | 0.997 |