 3
3peptides
spectra
0.000 | 0.000
0.000 | 0.000
0.000 | 0.000
0.000 | 0.000
0.029 | 0.057
0.219 | 0.252
0.436 | 0.448
0.270 | 0.283
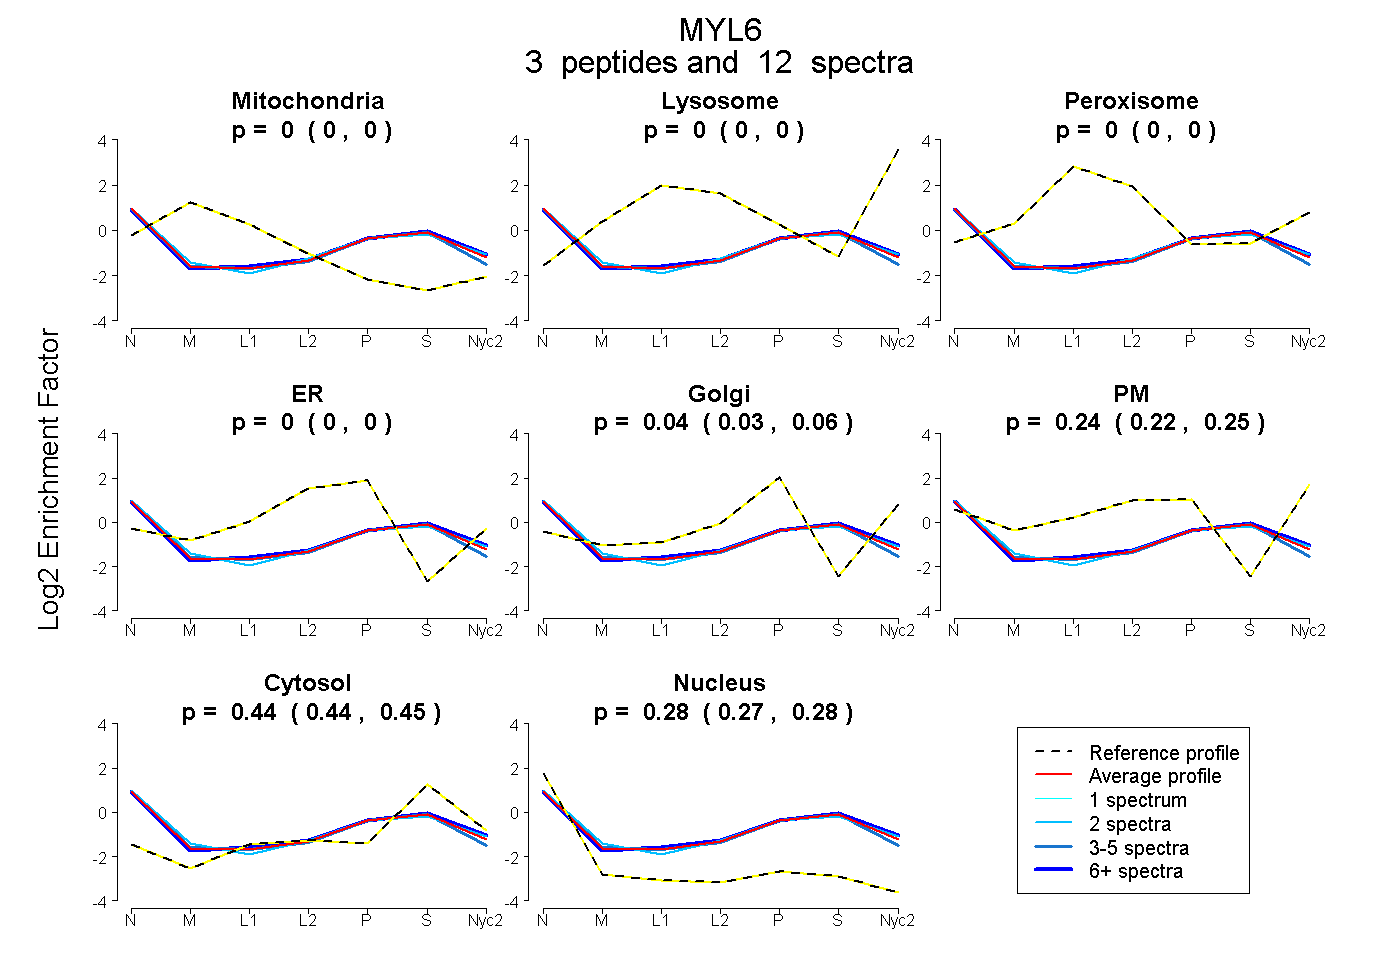
| Plot | Mito | Lyso | Perox | ER | Golgi | PM | Cytosol | Nucleus | |||||
| Expt A |
3 peptides |
12 spectra |
|
0.000 0.000 | 0.000 |
0.000 0.000 | 0.000 |
0.000 0.000 | 0.000 |
0.000 0.000 | 0.000 |
0.044 0.029 | 0.057 |
0.237 0.219 | 0.252 |
0.442 0.436 | 0.448 |
0.277 0.270 | 0.283 |
| 2 spectra, VLGNPK | 0.000 | 0.000 | 0.000 | 0.000 | 0.062 | 0.246 | 0.409 | 0.284 | ||
| 6 spectra, EAFQLFDR | 0.000 | 0.000 | 0.000 | 0.000 | 0.011 | 0.272 | 0.457 | 0.259 | ||
| 4 spectra, ILYSQCGDVMR | 0.000 | 0.000 | 0.000 | 0.060 | 0.044 | 0.160 | 0.439 | 0.297 |
| Plot | Lyso | Other | |||||||||||
| Expt C |
4 peptides |
31 spectra |
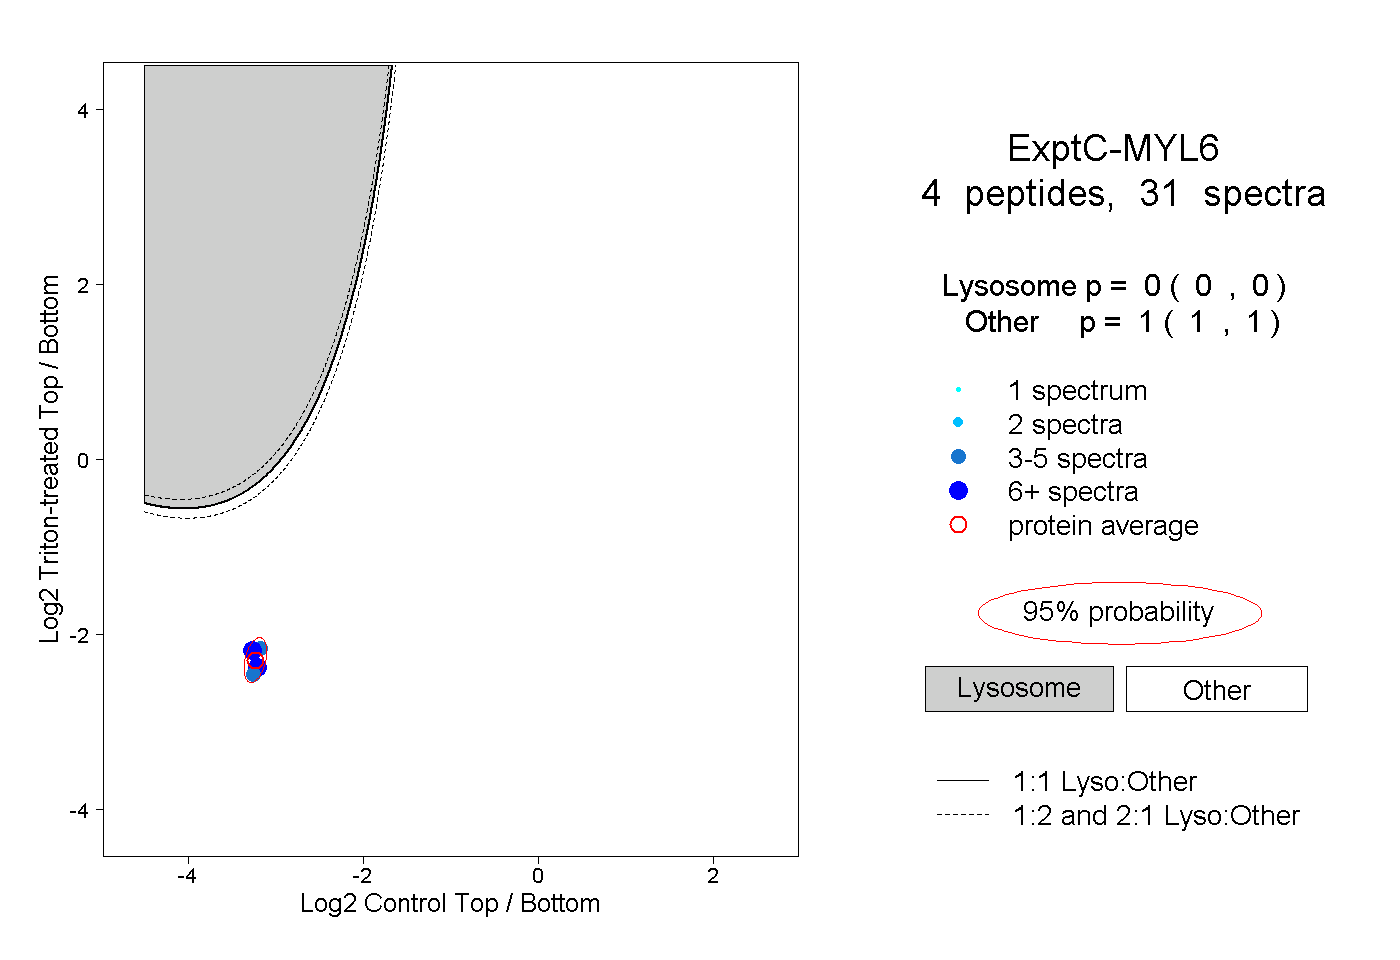 |
0.000 0.000 | 0.000 |
1.000 1.000 | 1.000 |
||||||||
| Plot | Lyso | Other | |||||||||||
| Expt D |
1 peptide |
1 spectrum |
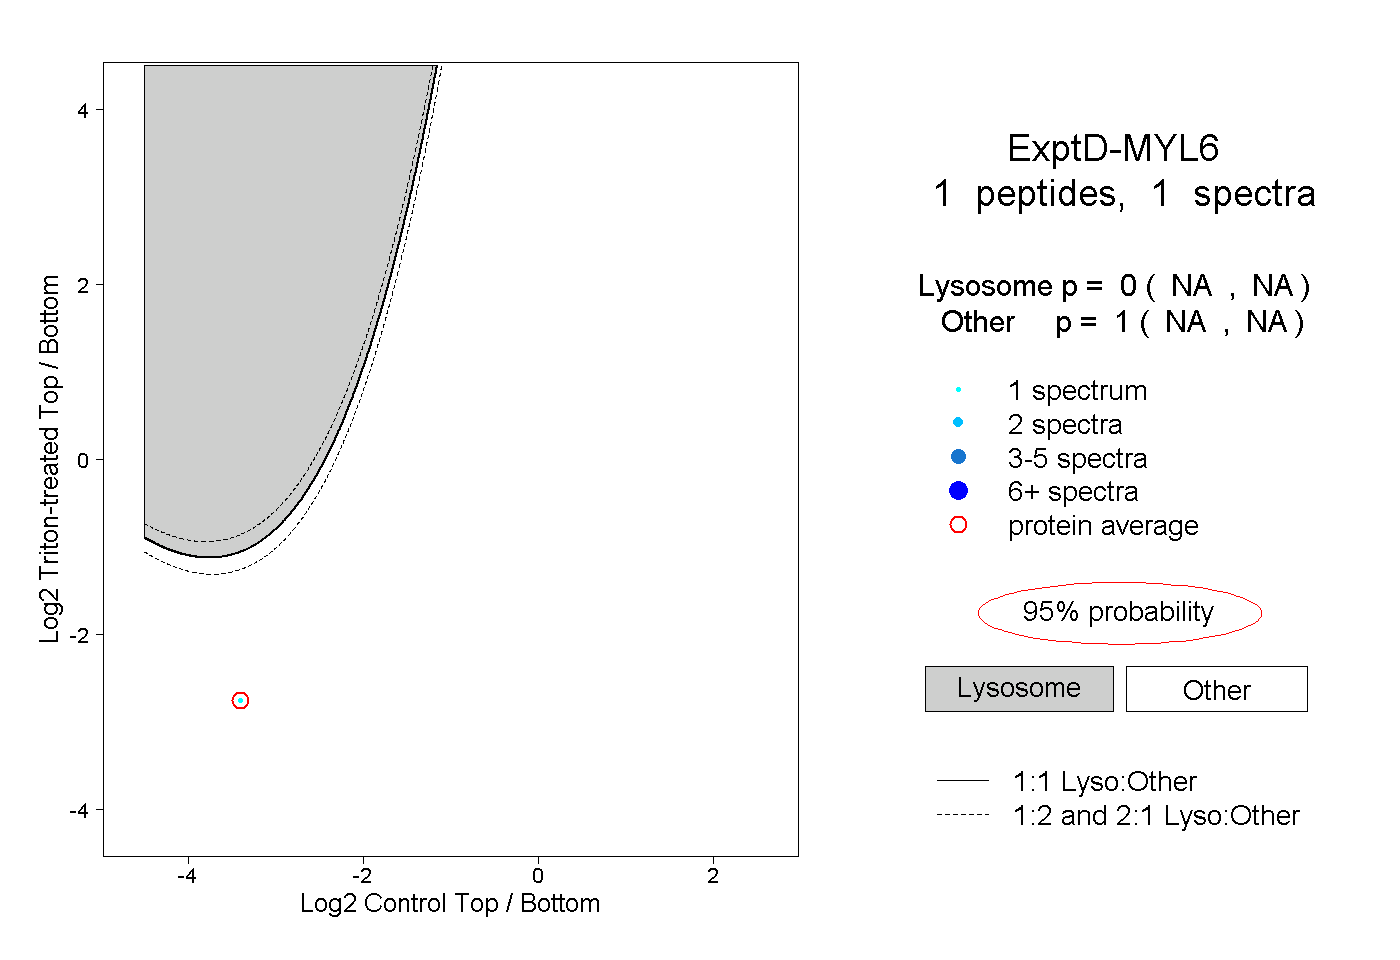 |
0.000 NA | NA |
1.000 NA | NA |