| 4 spectra, AVQMGMSSVFFNK |
0.000 |
|
0.108 |
|
0.000 |
0.000 |
0.000 |
0.892 |
0.000 |
|
| 3 spectra, CPQSEEGATYEGIQK |
0.000 |
|
0.199 |
|
0.000 |
0.008 |
0.000 |
0.793 |
0.000 |
|
| 9 spectra, EESFGPIMIISR |
0.000 |
|
0.000 |
|
0.000 |
0.000 |
0.000 |
1.000 |
0.000 |
|
| 19 spectra, FADGDVDAVLSR |
0.000 |
|
0.000 |
|
0.000 |
0.000 |
0.000 |
1.000 |
0.000 |
|
| 1 spectrum, GQALPEVVAK |
0.000 |
|
0.000 |
|
0.000 |
0.000 |
0.000 |
1.000 |
0.000 |
|
| 29 spectra, IQGATIPINQARPNR |
0.000 |
|
0.000 |
|
0.000 |
0.000 |
0.000 |
1.000 |
0.000 |
|
| 36 spectra, LIAEGTAPR |
0.000 |
|
0.000 |
|
0.000 |
0.000 |
0.000 |
1.000 |
0.000 |
|
| 8 spectra, ILPNVPEVEDSTDFFK |
0.051 |
|
0.060 |
|
0.000 |
0.000 |
0.000 |
0.889 |
0.000 |
|
| 2 spectra, DGVPVFK |
0.000 |
|
0.072 |
|
0.000 |
0.029 |
0.000 |
0.898 |
0.000 |
|
| 13 spectra, GMVQAVR |
0.000 |
|
0.000 |
|
0.000 |
0.000 |
0.000 |
1.000 |
0.000 |
|
| 1 spectrum, LEAGTVFINTYNK |
0.003 |
|
0.354 |
|
0.000 |
0.039 |
0.122 |
0.482 |
0.000 |
|
| 6 spectra, GVVNILPGSGSLVGQR |
0.000 |
|
0.235 |
|
0.035 |
0.000 |
0.000 |
0.729 |
0.000 |
|
| 5 spectra, LSDHPDVR |
0.000 |
|
0.040 |
|
0.005 |
0.000 |
0.000 |
0.955 |
0.000 |
|
| 3 spectra, IGFTGSTEVGK |
0.000 |
|
0.000 |
|
0.000 |
0.000 |
0.000 |
0.762 |
0.238 |
|
| 4 spectra, FAELTLK |
0.000 |
|
0.000 |
|
0.000 |
0.000 |
0.000 |
1.000 |
0.000 |
|
| 1 spectrum, MMPASQFFK |
0.000 |
|
0.000 |
|
0.000 |
0.000 |
0.000 |
1.000 |
0.000 |
|
| 3 spectra, FLFPEGIK |
0.216 |
|
0.000 |
|
0.000 |
0.000 |
0.000 |
0.784 |
0.000 |
|
| 28 spectra, GFIQLLVR |
0.000 |
|
0.000 |
|
0.000 |
0.000 |
0.000 |
1.000 |
0.000 |
|
| 15 spectra, SPLIIFADCDLNK |
0.000 |
|
0.038 |
|
0.000 |
0.000 |
0.000 |
0.962 |
0.000 |
|
| 1 spectrum, ECEVLPDDTVSTLYNR |
0.000 |
|
0.000 |
|
0.000 |
0.000 |
0.000 |
1.000 |
0.000 |
|
| 7 spectra, THVGMSIQTFR |
0.028 |
|
0.205 |
|
0.000 |
0.085 |
0.000 |
0.682 |
0.000 |
|
| 11 spectra, GENCIAAGR |
0.121 |
|
0.000 |
|
0.000 |
0.000 |
0.000 |
0.879 |
0.000 |
|
| 2 spectra, VSLELGGK |
0.221 |
|
0.086 |
|
0.000 |
0.000 |
0.000 |
0.692 |
0.000 |
|
| 1 spectrum, GSASSDLELTEAELATAEAVR |
0.000 |
|
0.000 |
|
0.000 |
0.000 |
0.000 |
1.000 |
0.000 |
|
| 3 spectra, ADPLGLEAEK |
0.000 |
|
0.000 |
|
0.065 |
0.000 |
0.000 |
0.935 |
0.000 |
|
| 5 spectra, TDVAAPFGGFK |
0.000 |
|
0.000 |
|
0.111 |
0.000 |
0.000 |
0.889 |
0.000 |
|
| 2 spectra, GASAINWTLIHGDK |
0.000 |
|
0.000 |
|
0.000 |
0.000 |
0.000 |
1.000 |
0.000 |
|
| 15 spectra, INWDQPAEAIHNWIR |
0.000 |
|
0.000 |
|
0.000 |
0.000 |
0.000 |
1.000 |
0.000 |
|
| 20 spectra, AGLILFGNDDR |
0.000 |
|
0.000 |
|
0.000 |
0.000 |
0.000 |
1.000 |
0.000 |
|
| 2 spectra, YFAGWCDK |
0.135 |
|
0.000 |
|
0.000 |
0.000 |
0.000 |
0.865 |
0.000 |
|
| 6 spectra, ANATEFGLASGVFTR |
0.000 |
|
0.000 |
|
0.000 |
0.000 |
0.000 |
1.000 |
0.000 |
|
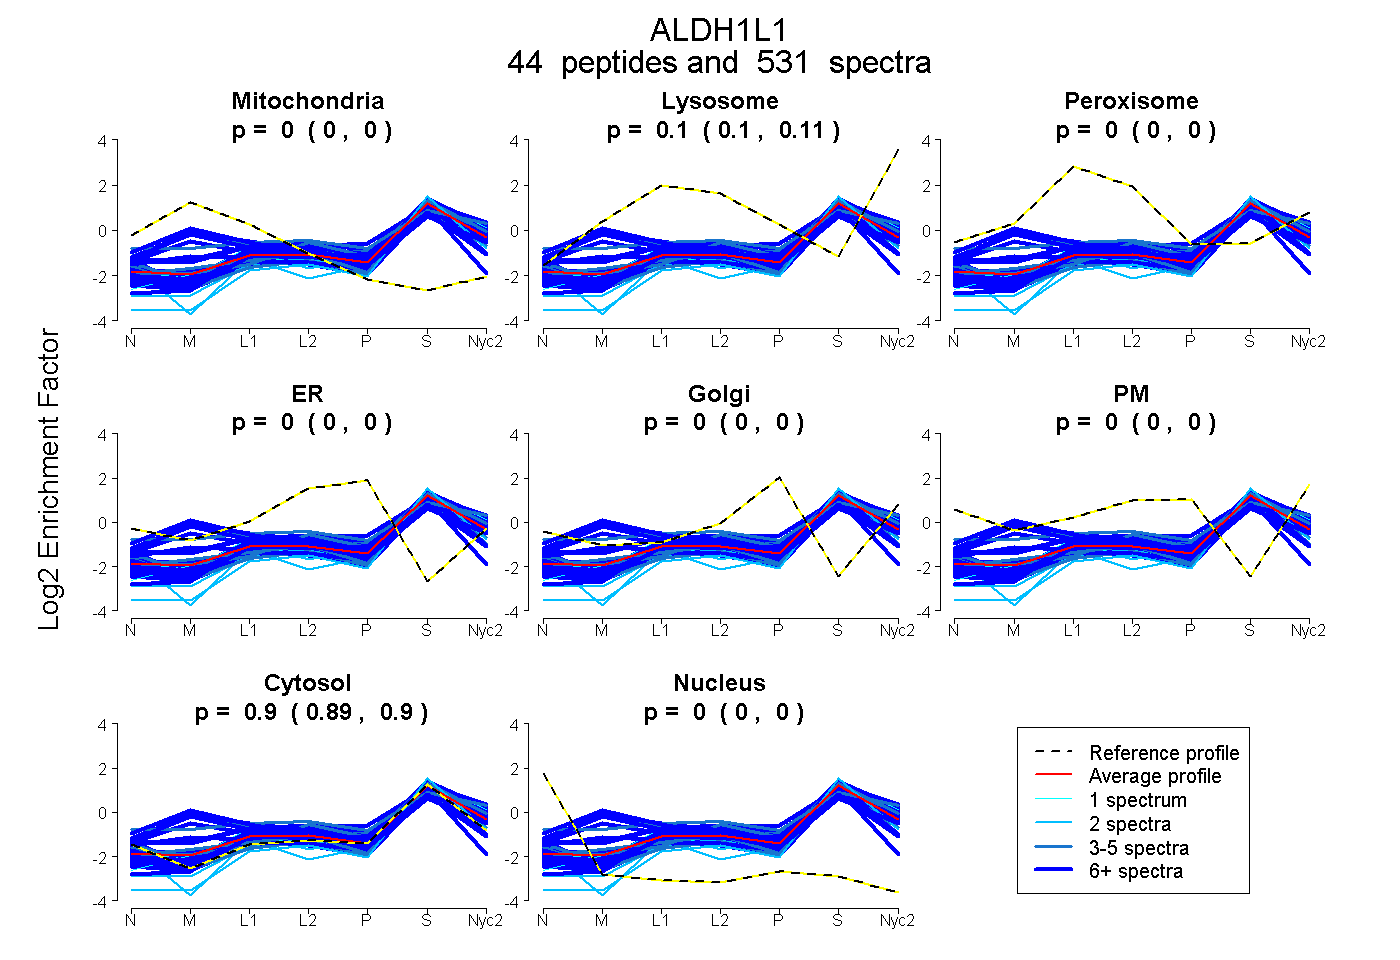
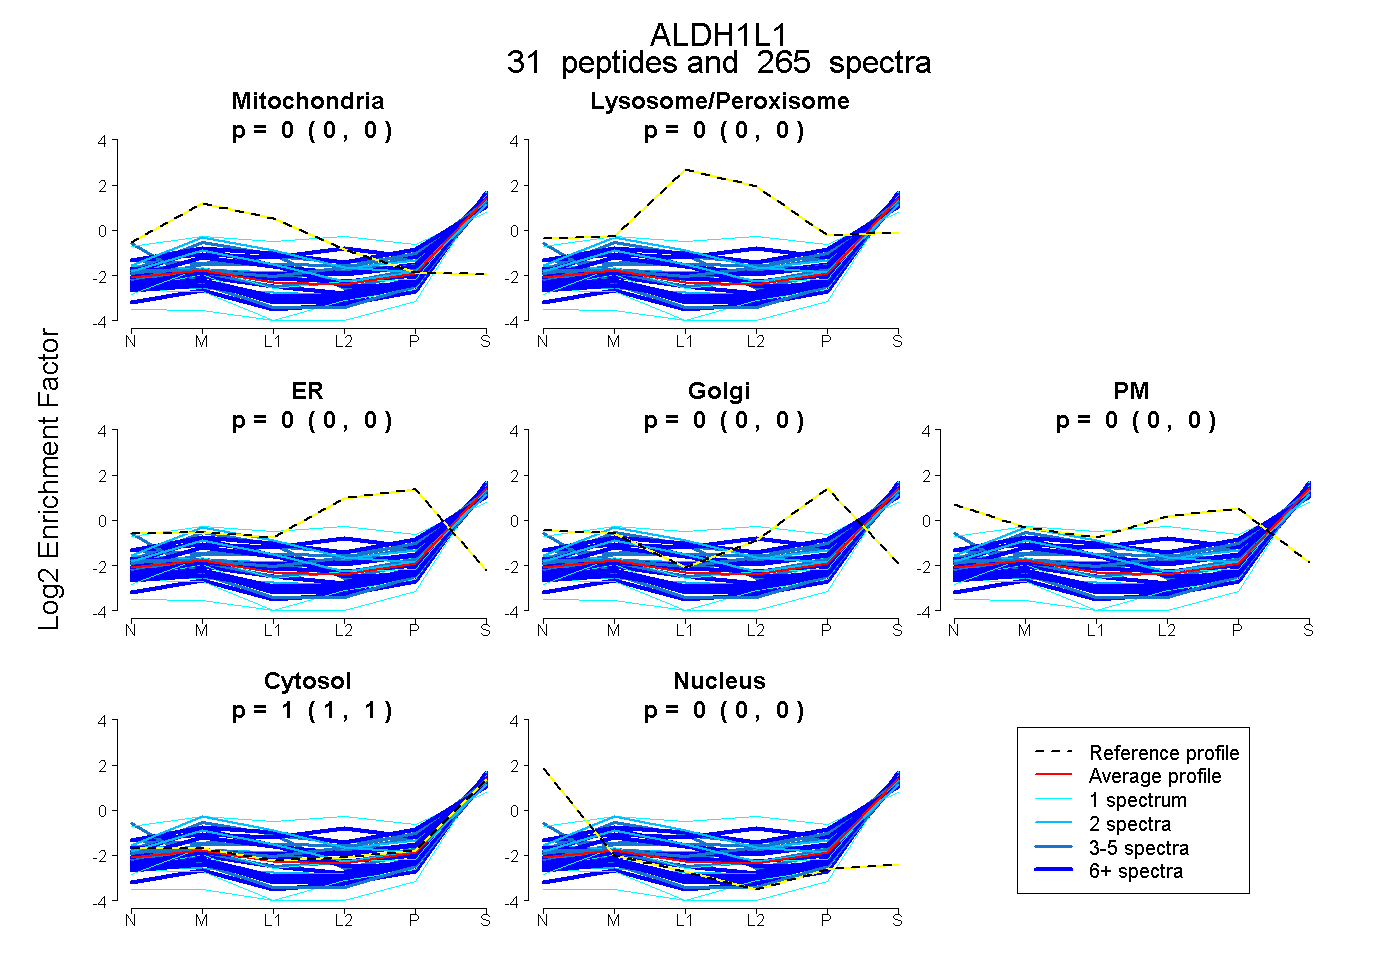
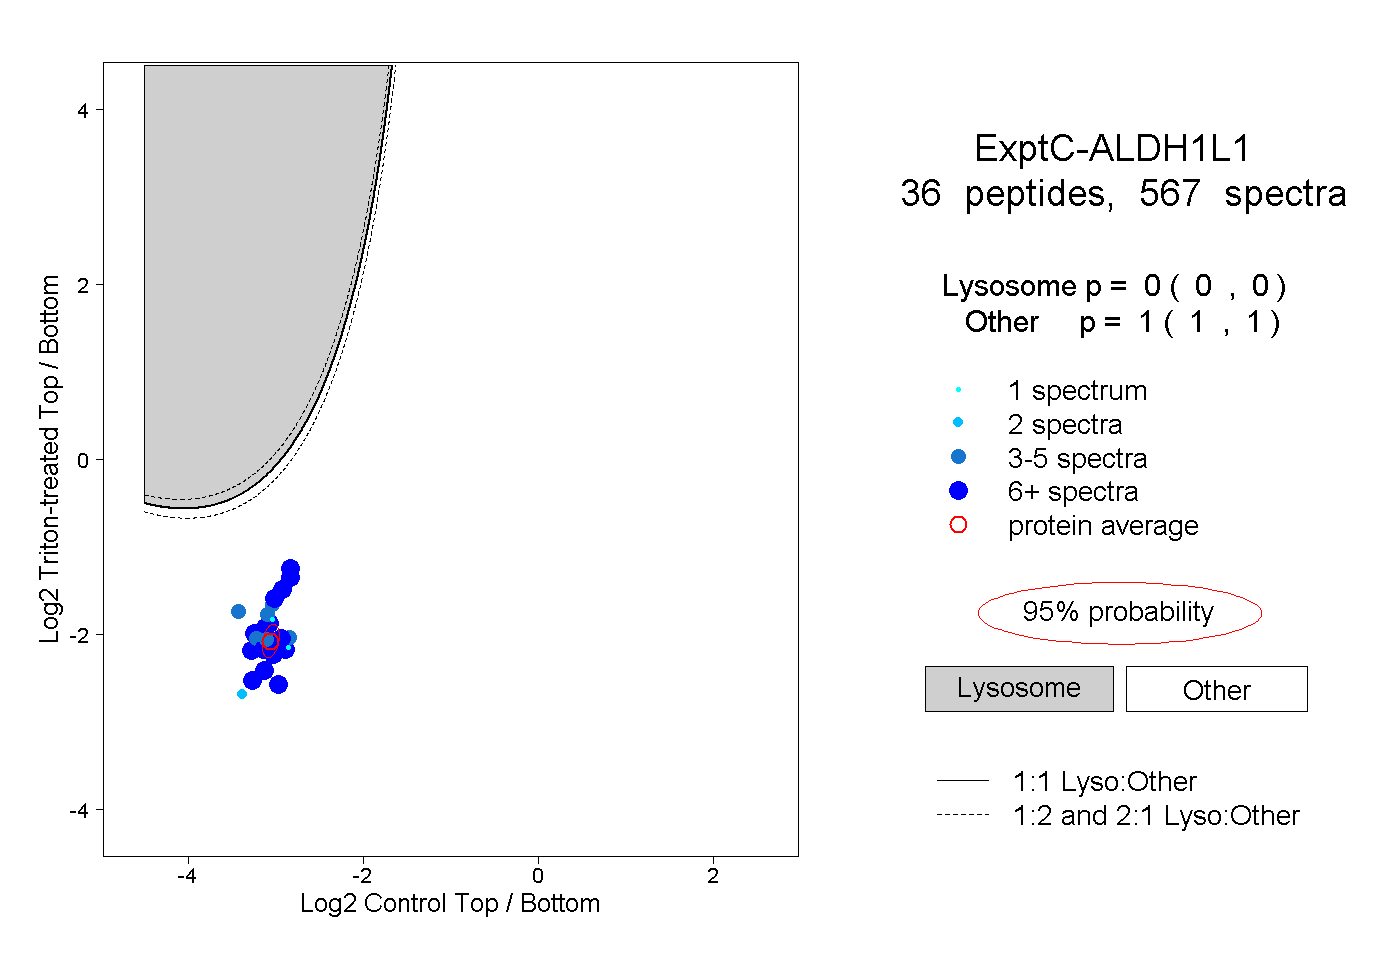
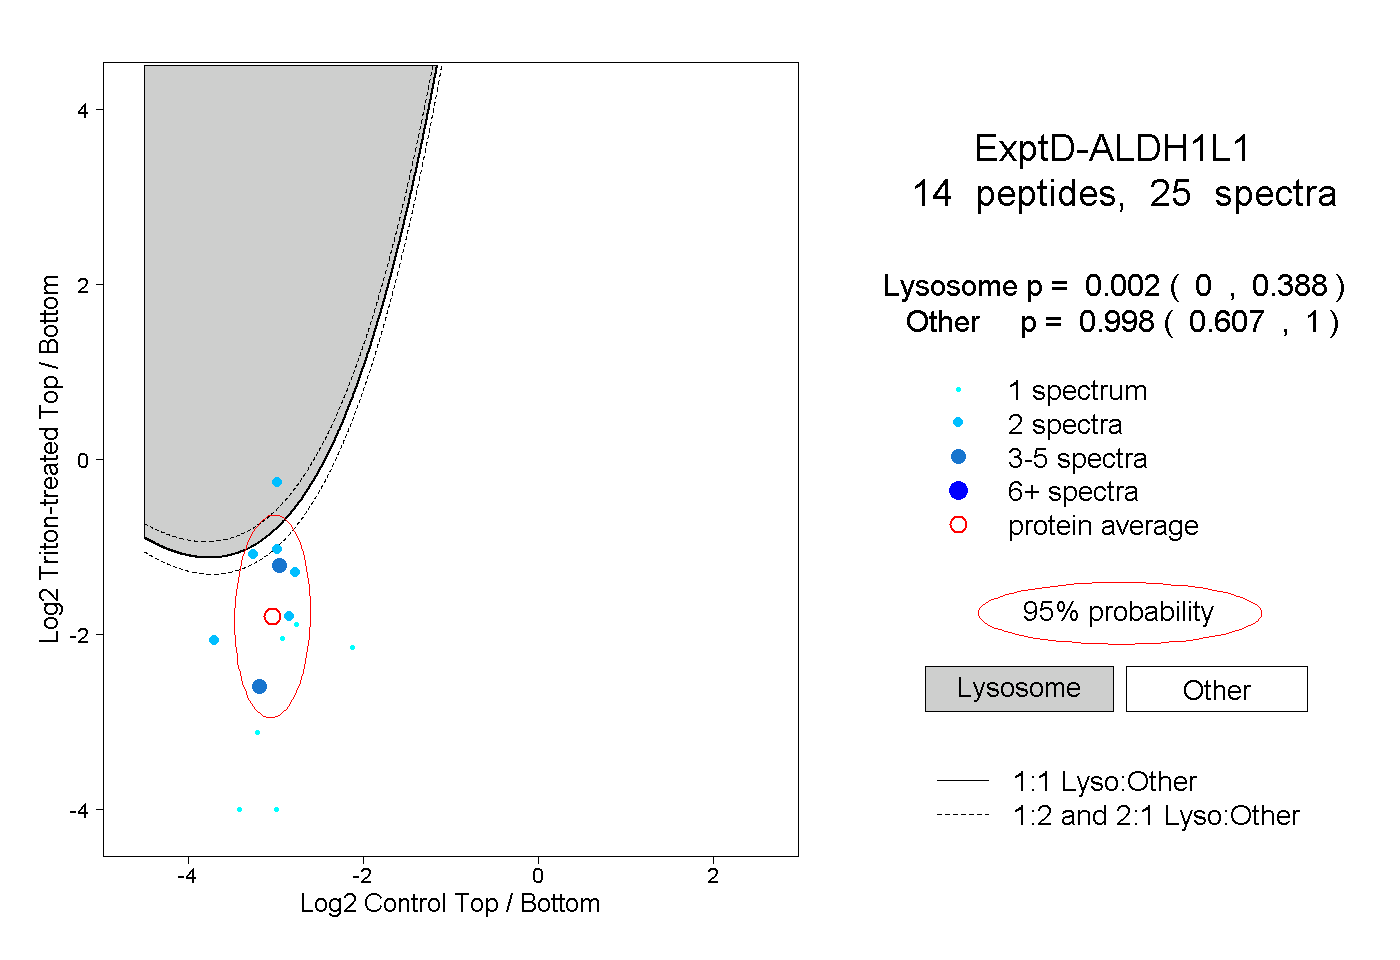
 44
44