 44
44peptides
spectra
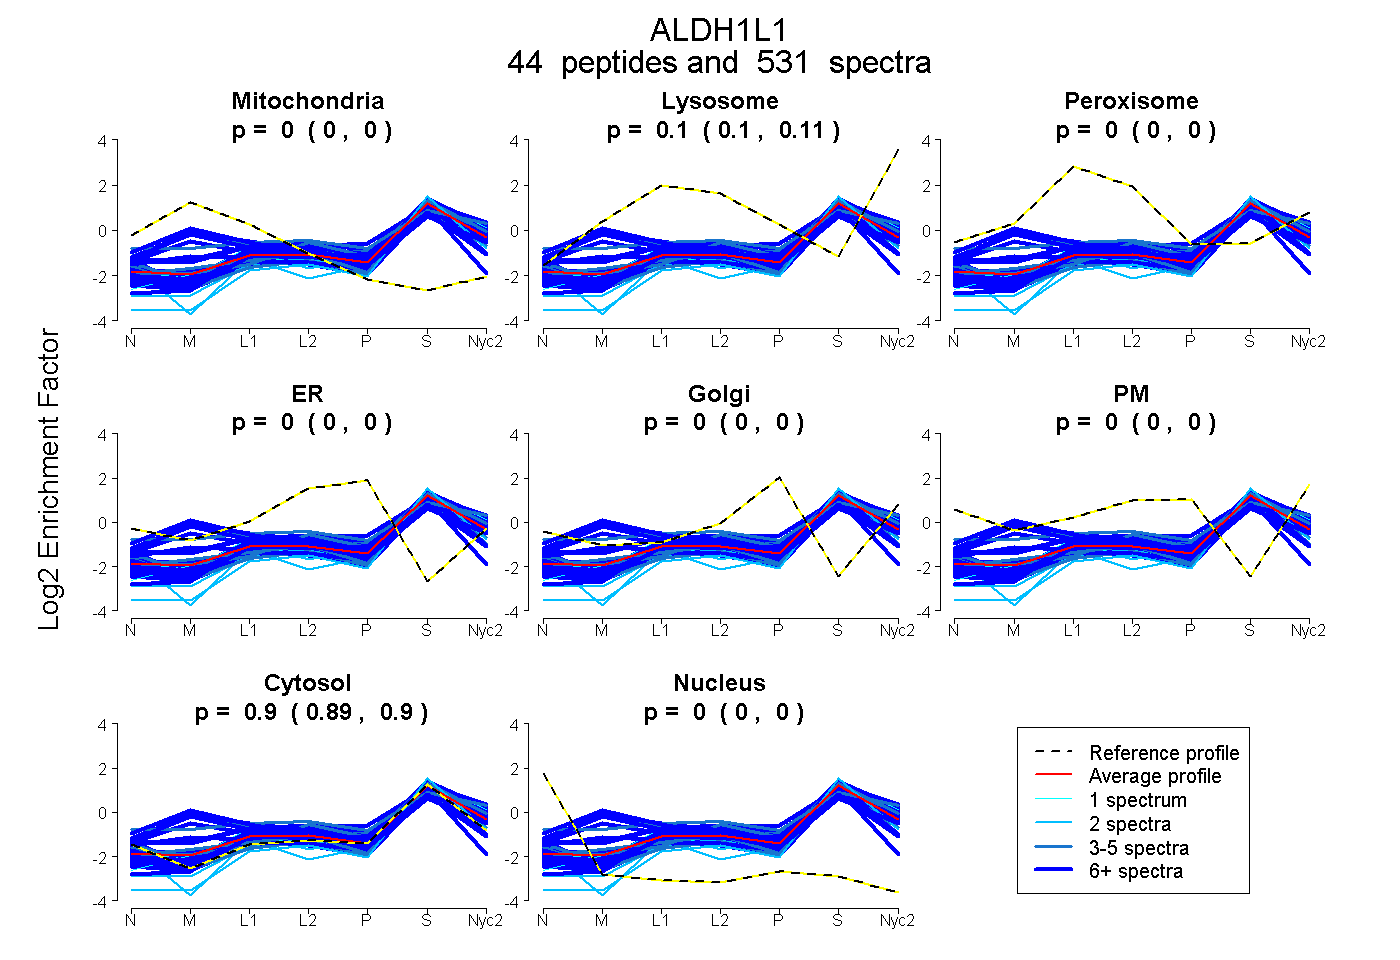
0.000 | 0.000
0.104 | 0.105
0.000 | 0.000
0.000 | 0.000
0.000 | 0.000
0.000 | 0.000
0.894 | 0.896
0.000 | 0.000
31peptides
spectra
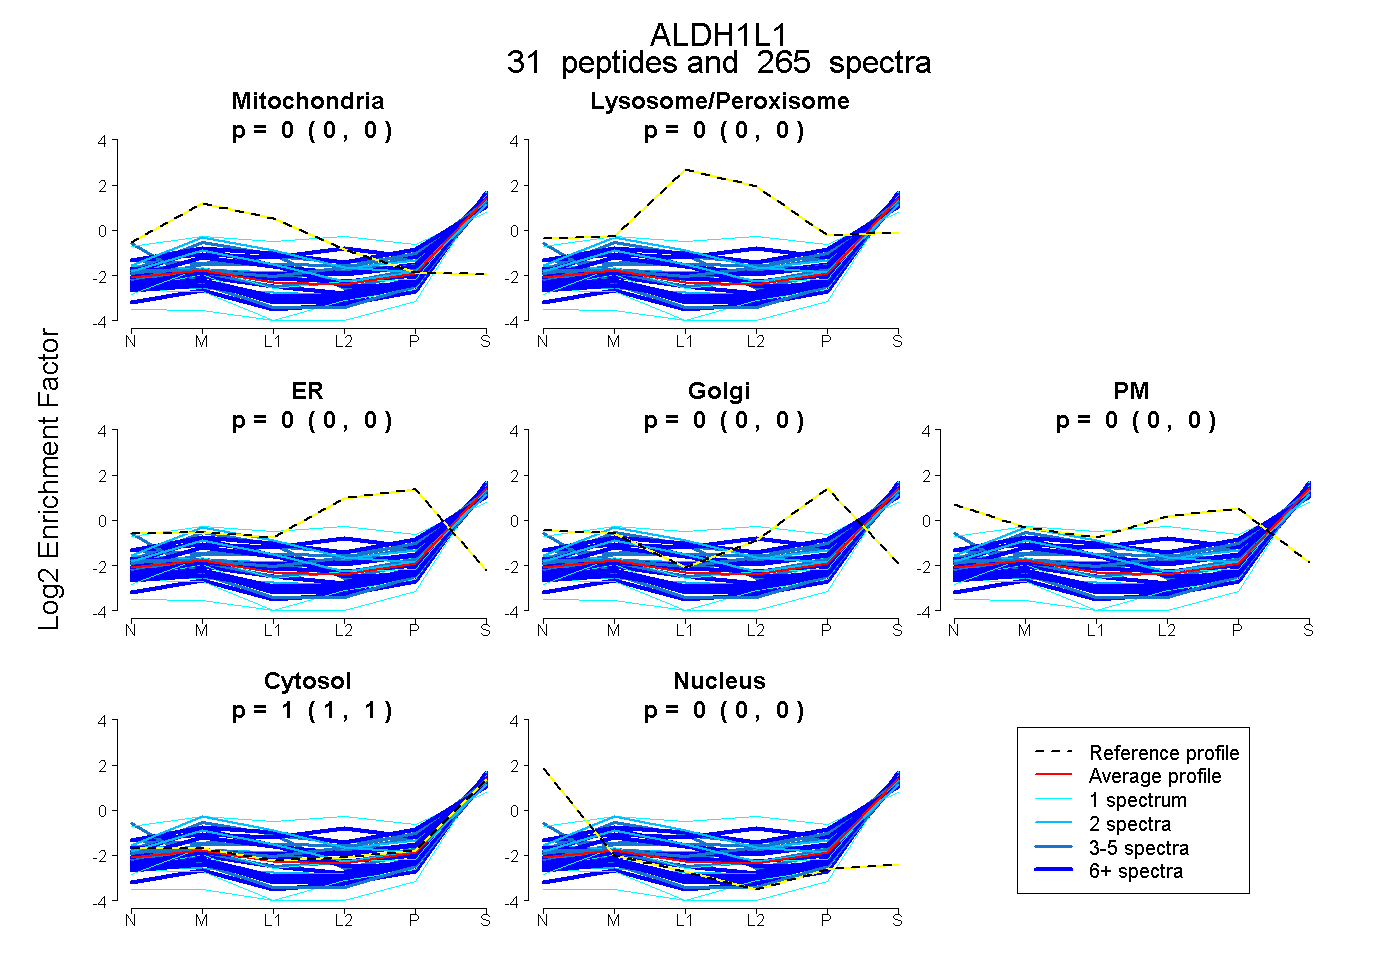
0.000 | 0.000
0.000 | 0.000
0.000 | 0.000
0.000 | 0.000
0.000 | 0.000
1.000 | 1.000
0.000 | 0.000
36peptides
spectra
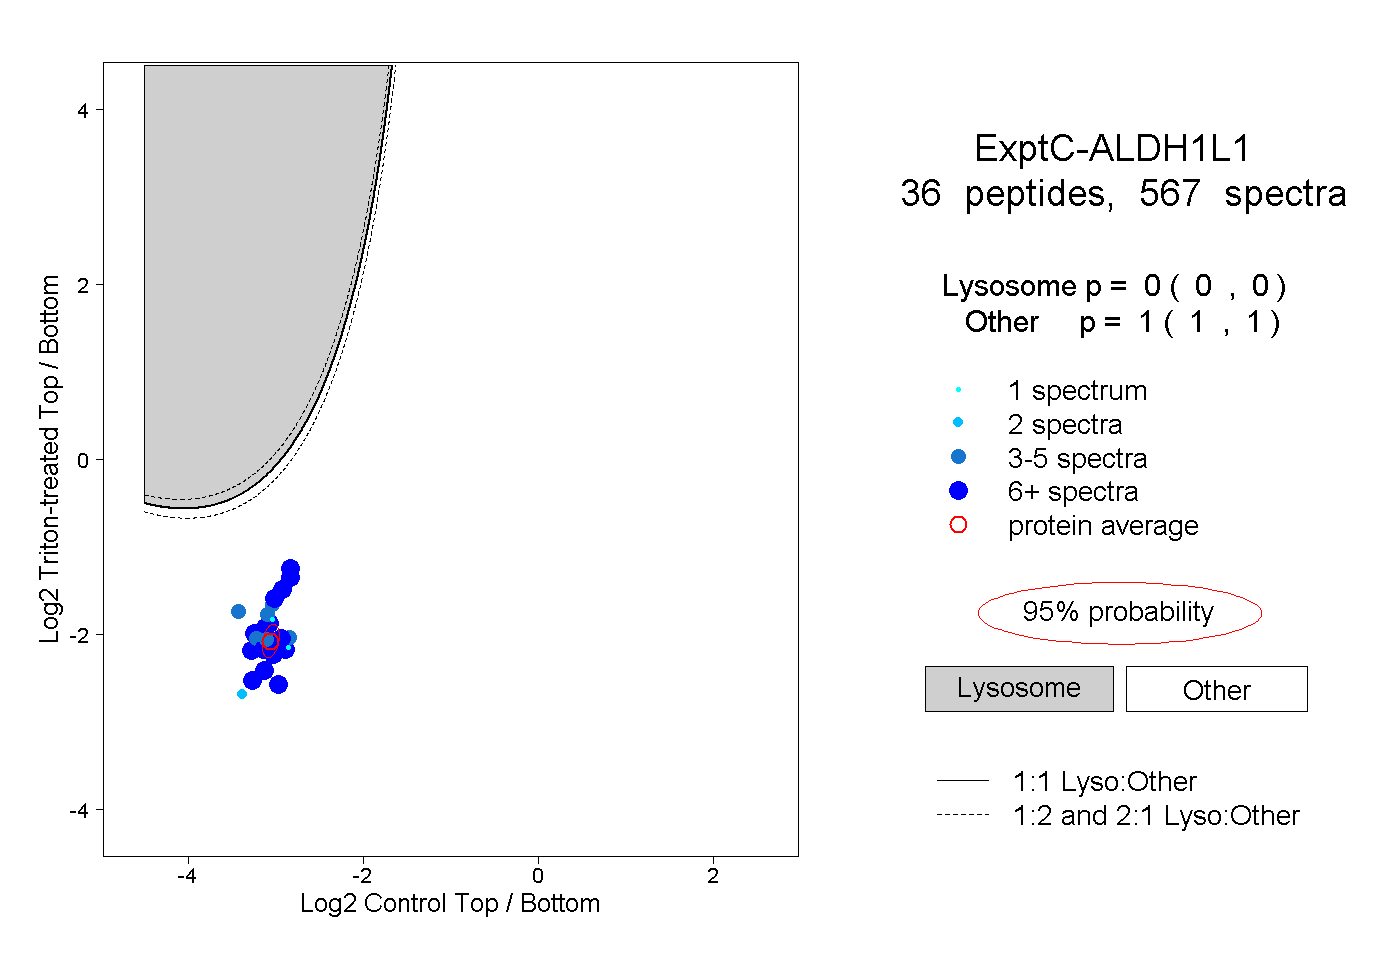
0.000 | 0.000
1.000 | 1.000
14peptides
spectra
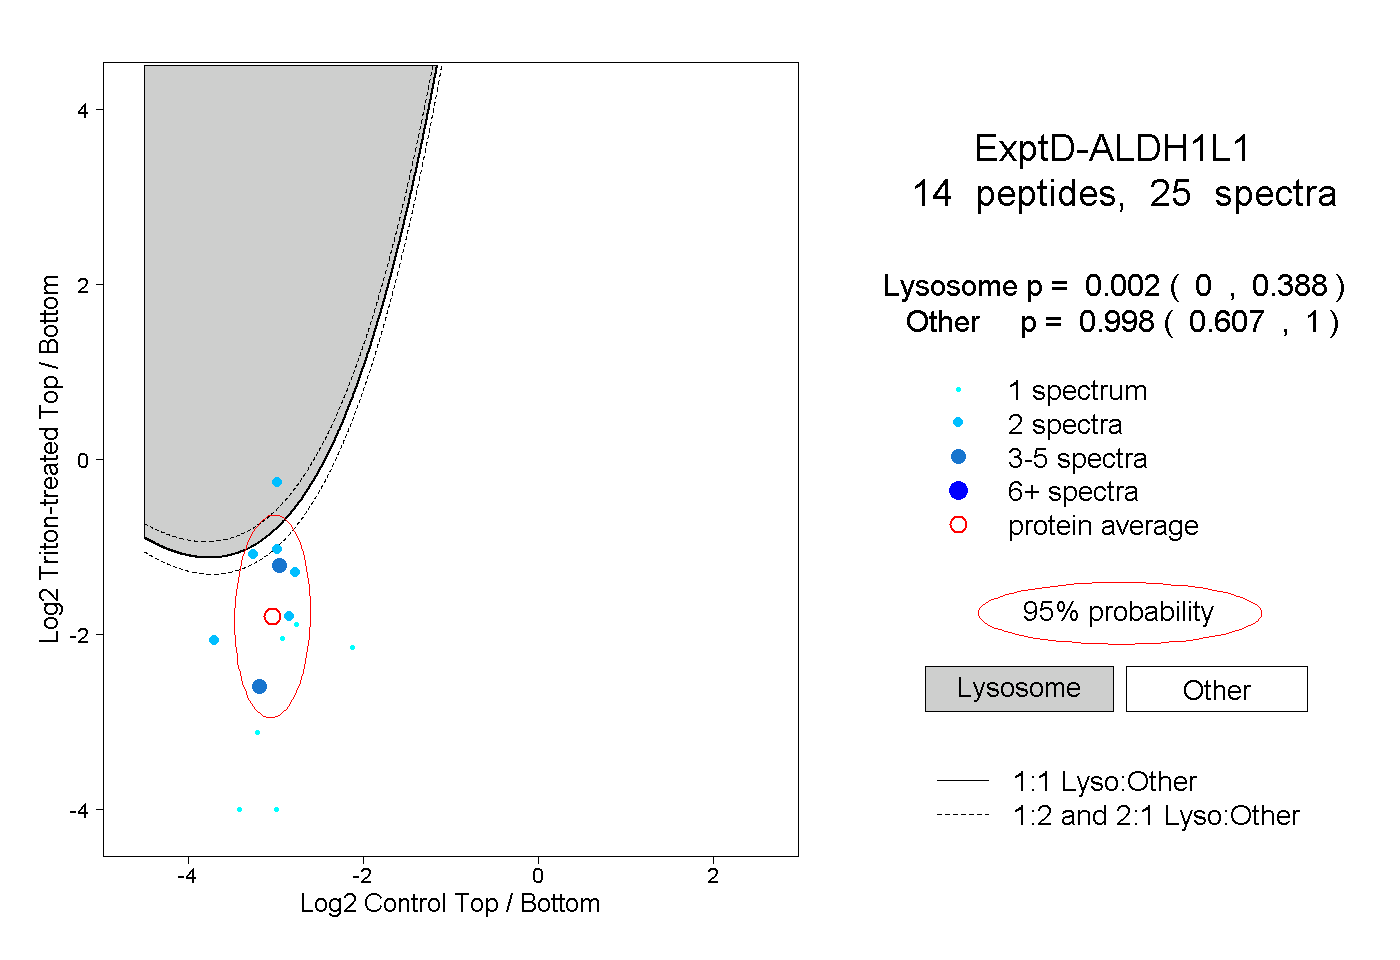
0.000 | 0.388
0.607 | 1.000