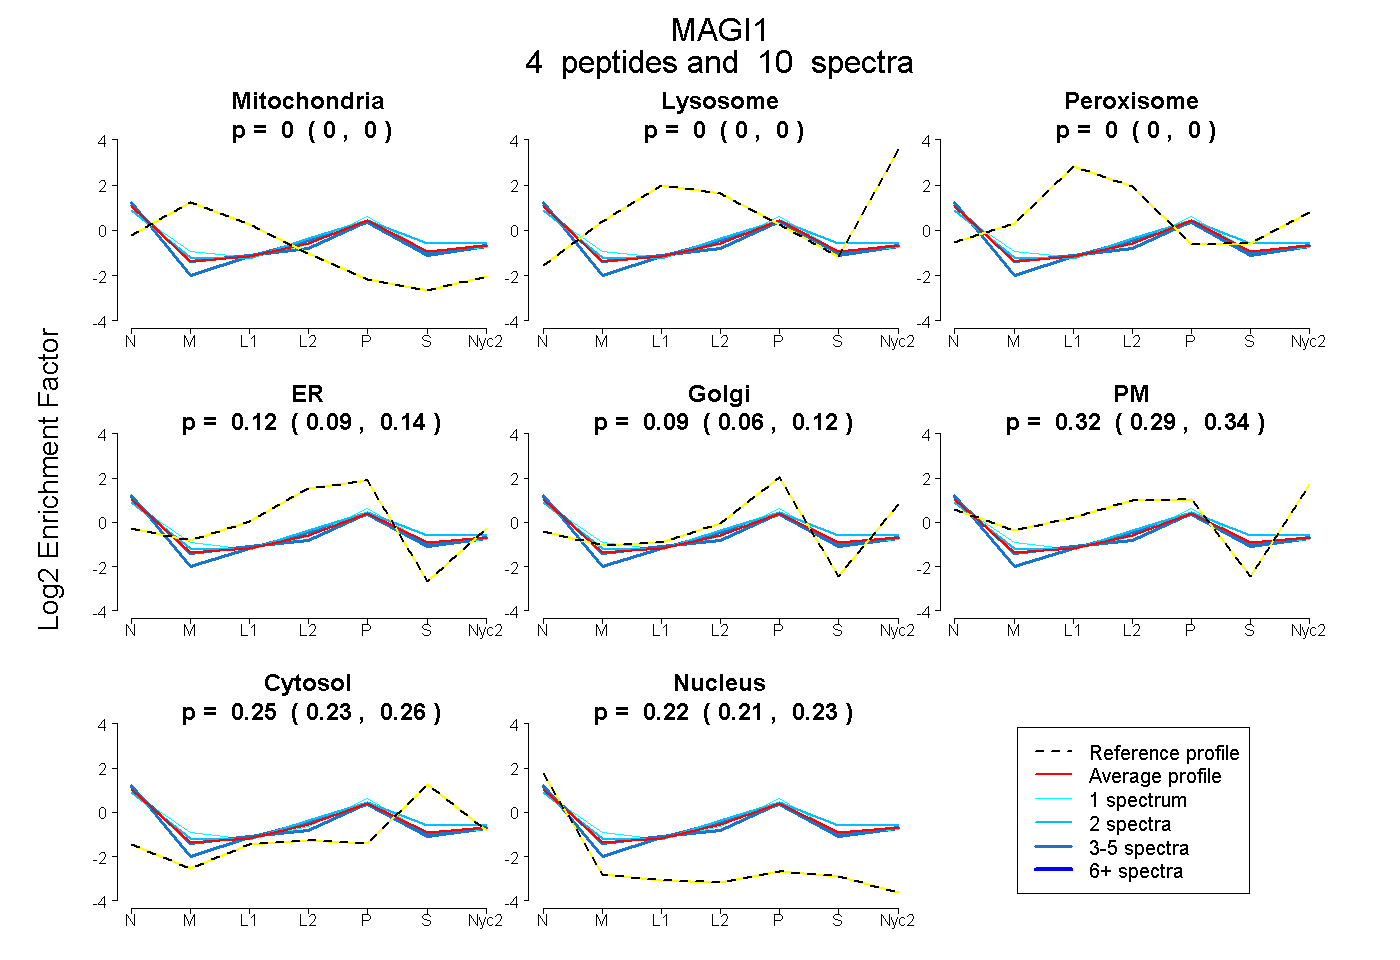
 4
4peptides
spectra
0.000 | 0.000
0.000 | 0.000
0.000 | 0.000
0.088 | 0.140
0.065 | 0.119
0.294 | 0.341
0.234 | 0.261
0.211 | 0.228
3peptides
spectra
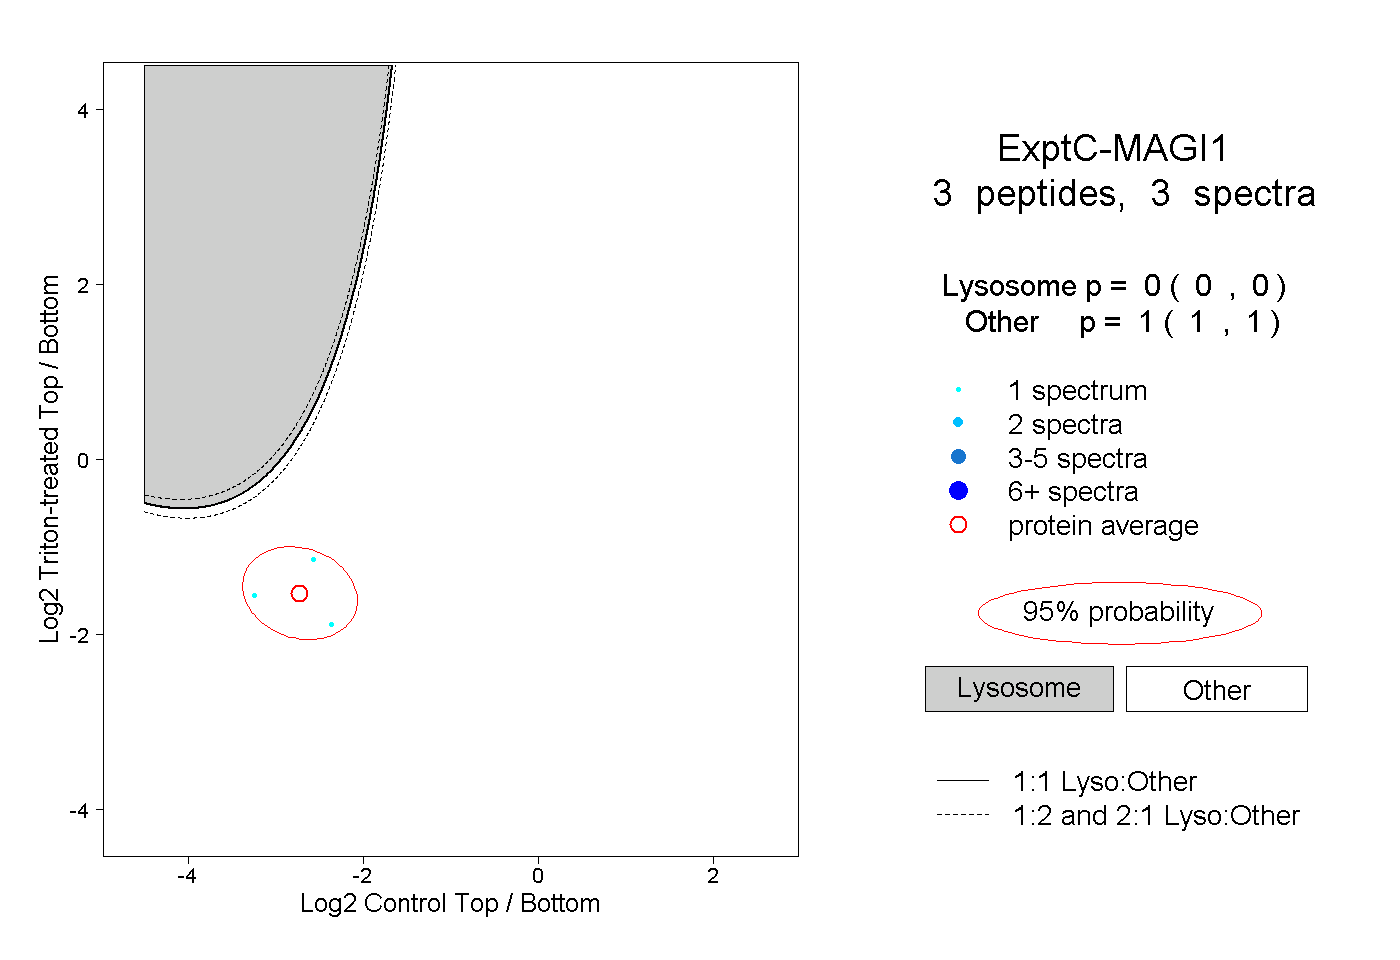
0.000 | 0.000
1.000 | 1.000
| Plot | Mito | Lyso | Perox | ER | Golgi | PM | Cytosol | Nucleus | |||||
| Expt A |
4 peptides |
10 spectra |
|
0.000 0.000 | 0.000 |
0.000 0.000 | 0.000 |
0.000 0.000 | 0.000 |
0.117 0.088 | 0.140 |
0.094 0.065 | 0.119 |
0.320 0.294 | 0.341 |
0.249 0.234 | 0.261 |
0.220 0.211 | 0.228 |
||
| Plot | Lyso | Other | |||||||||||
| Expt C |
3 peptides |
3 spectra |
|
0.000 0.000 | 0.000 |
1.000 1.000 | 1.000 |