 3
3peptides
spectra
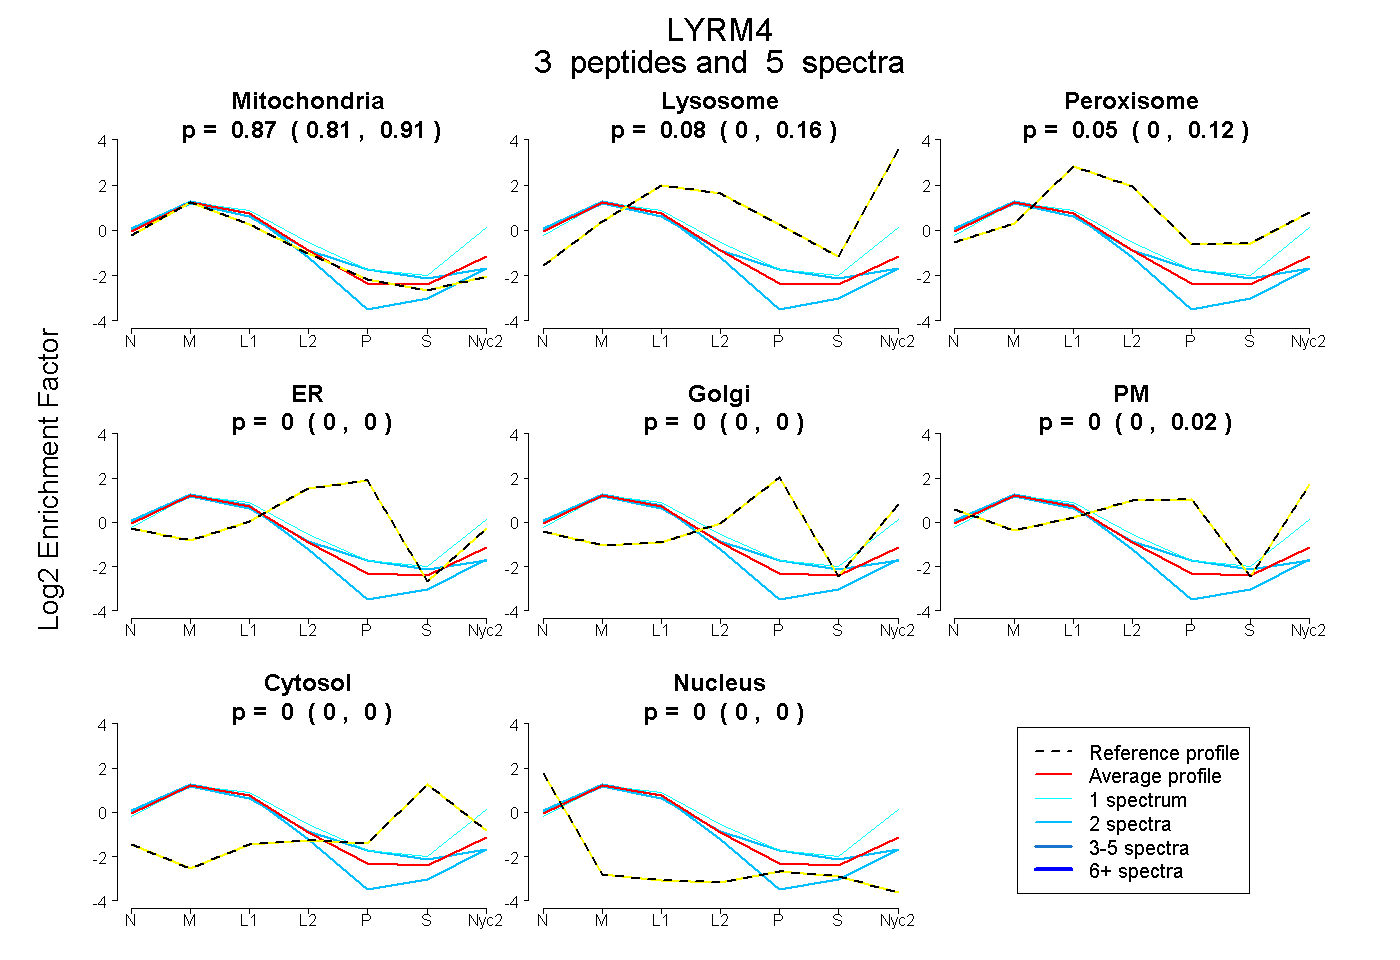
0.811 | 0.913
0.000 | 0.160
0.000 | 0.121
0.000 | 0.000
0.000 | 0.000
0.000 | 0.025
0.000 | 0.000
0.000 | 0.003
1peptide
spectra
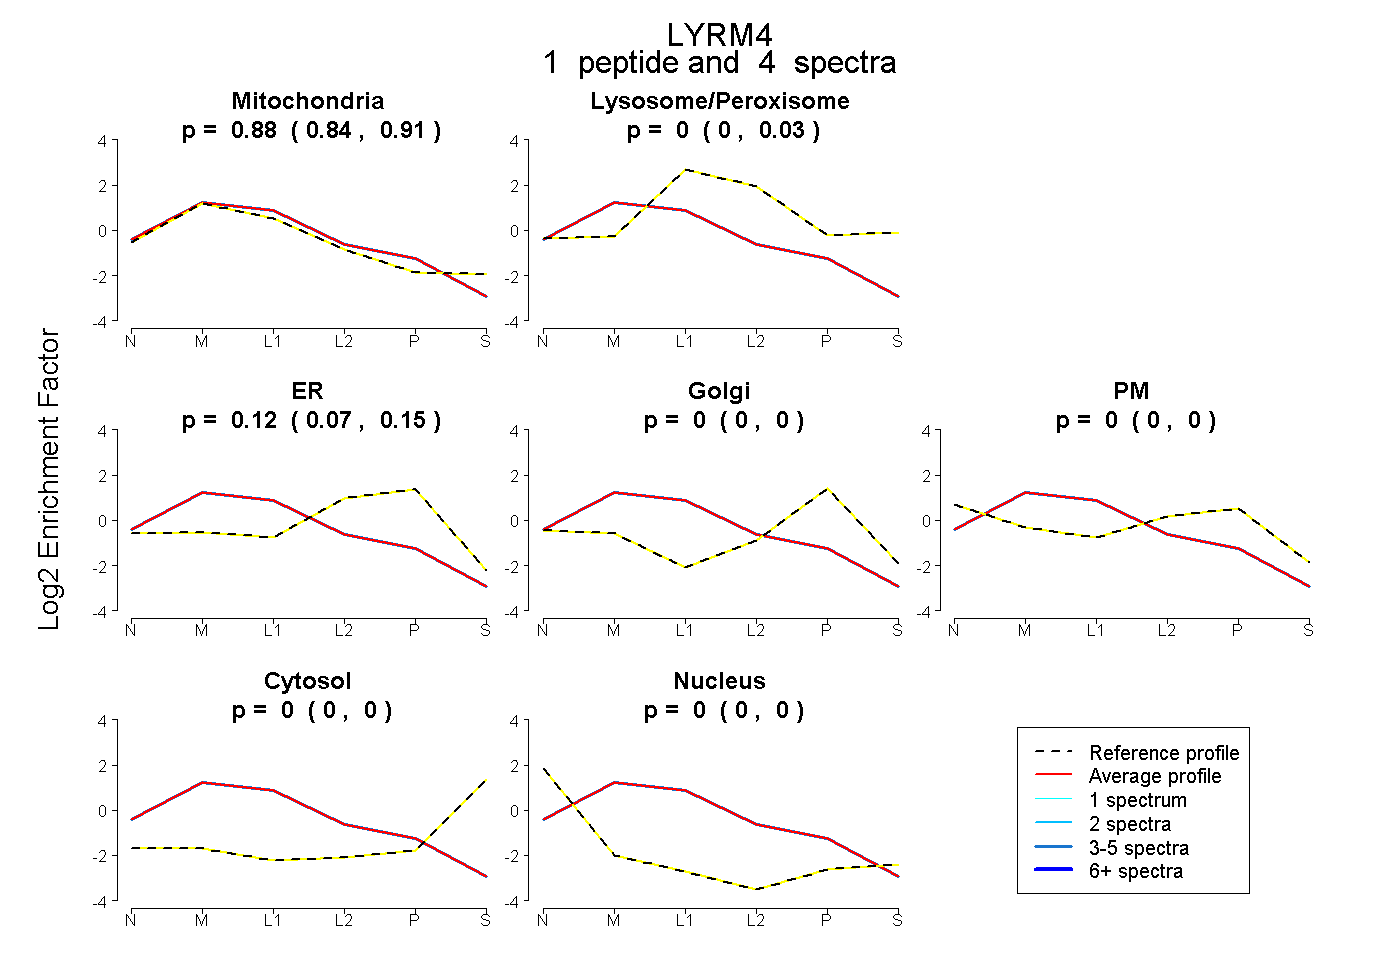
0.839 | 0.913
0.000 | 0.032
0.073 | 0.152
0.000 | 0.000
0.000 | 0.000
0.000 | 0.000
0.000 | 0.000
4peptides
spectra
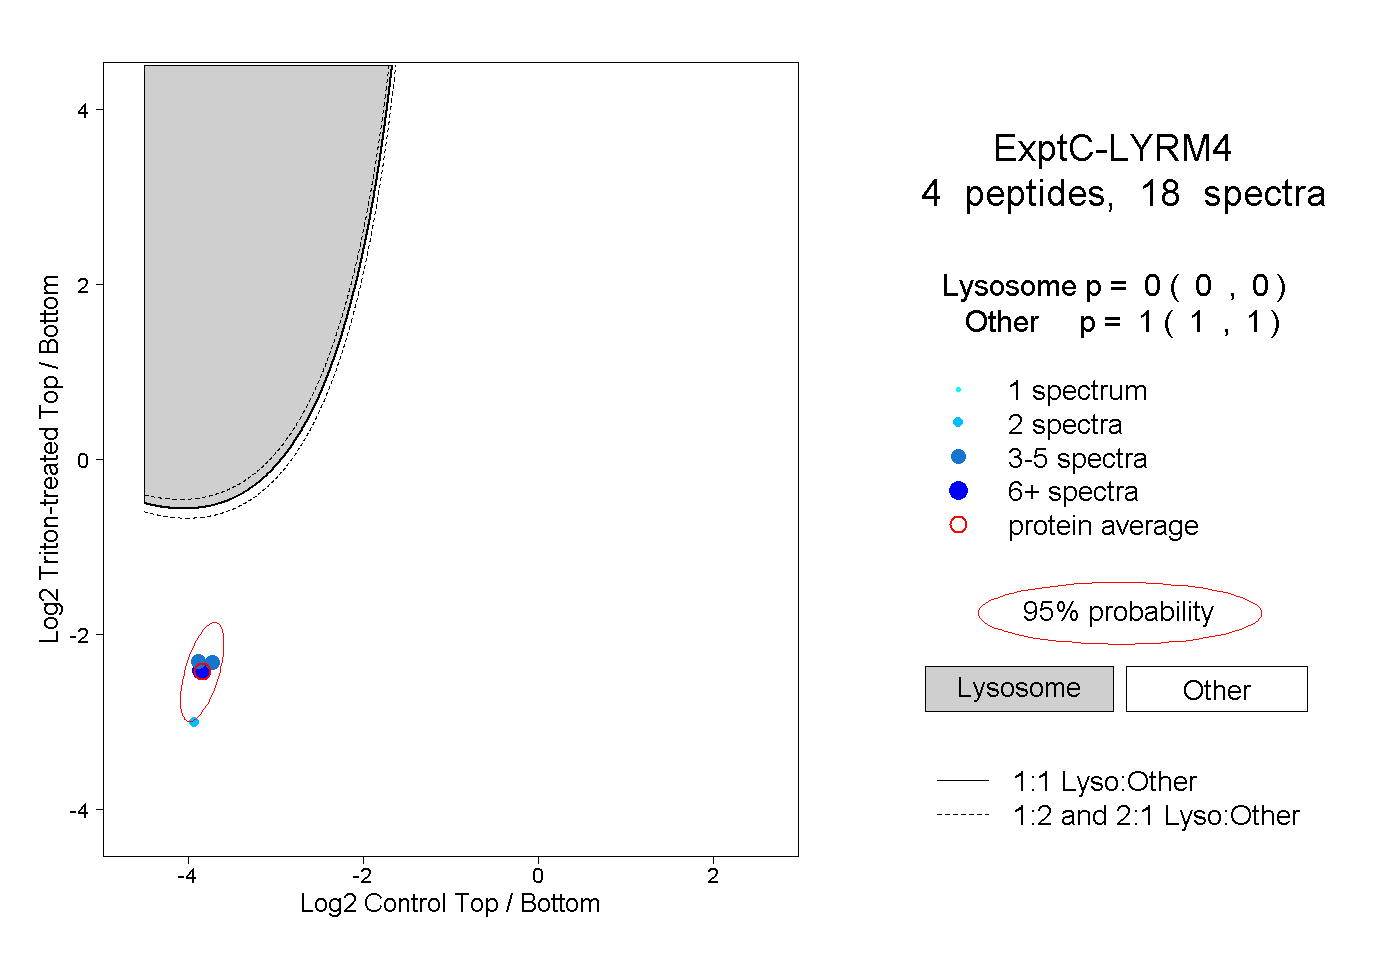
0.000 | 0.000
1.000 | 1.000
2peptides
spectra
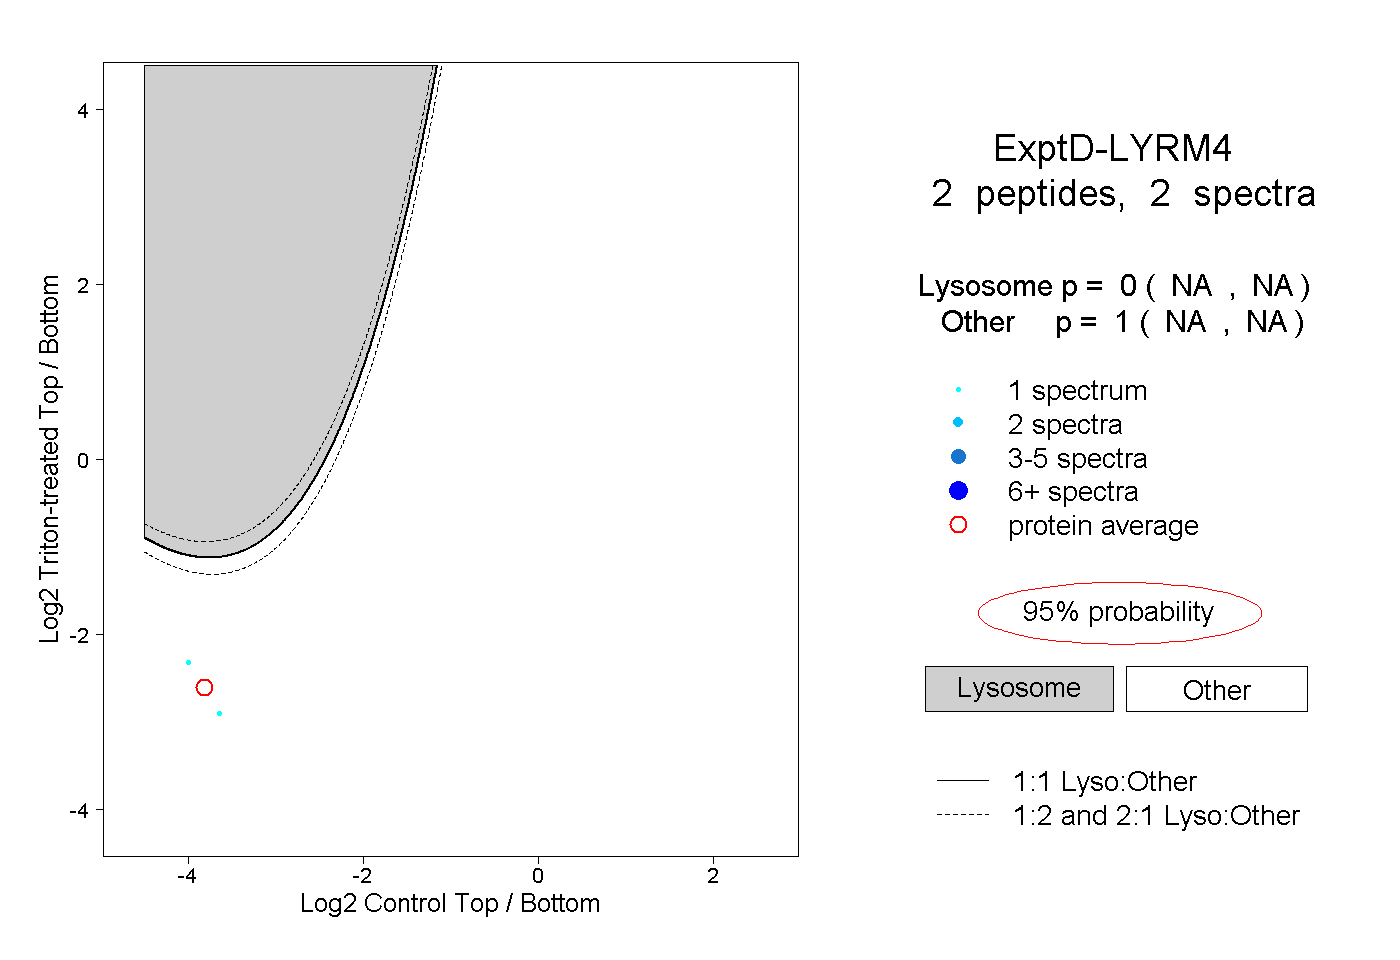
NA | NA
NA | NA