 5
5peptides
spectra
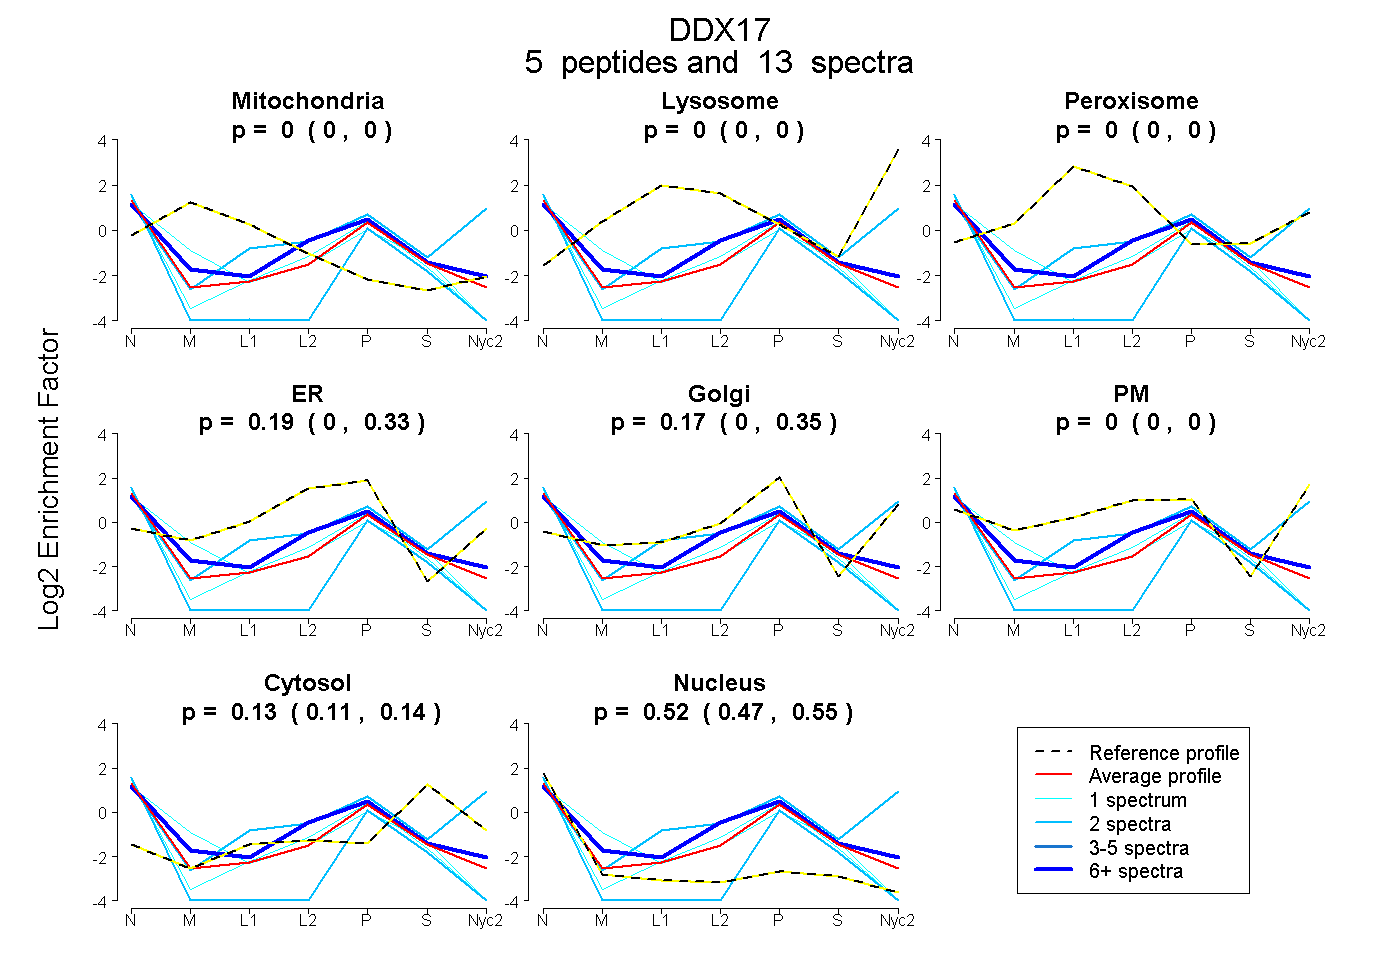
0.000 | 0.000
0.000 | 0.000
0.000 | 0.000
0.002 | 0.334
0.000 | 0.348
0.000 | 0.000
0.106 | 0.144
0.469 | 0.553
2peptides
spectra
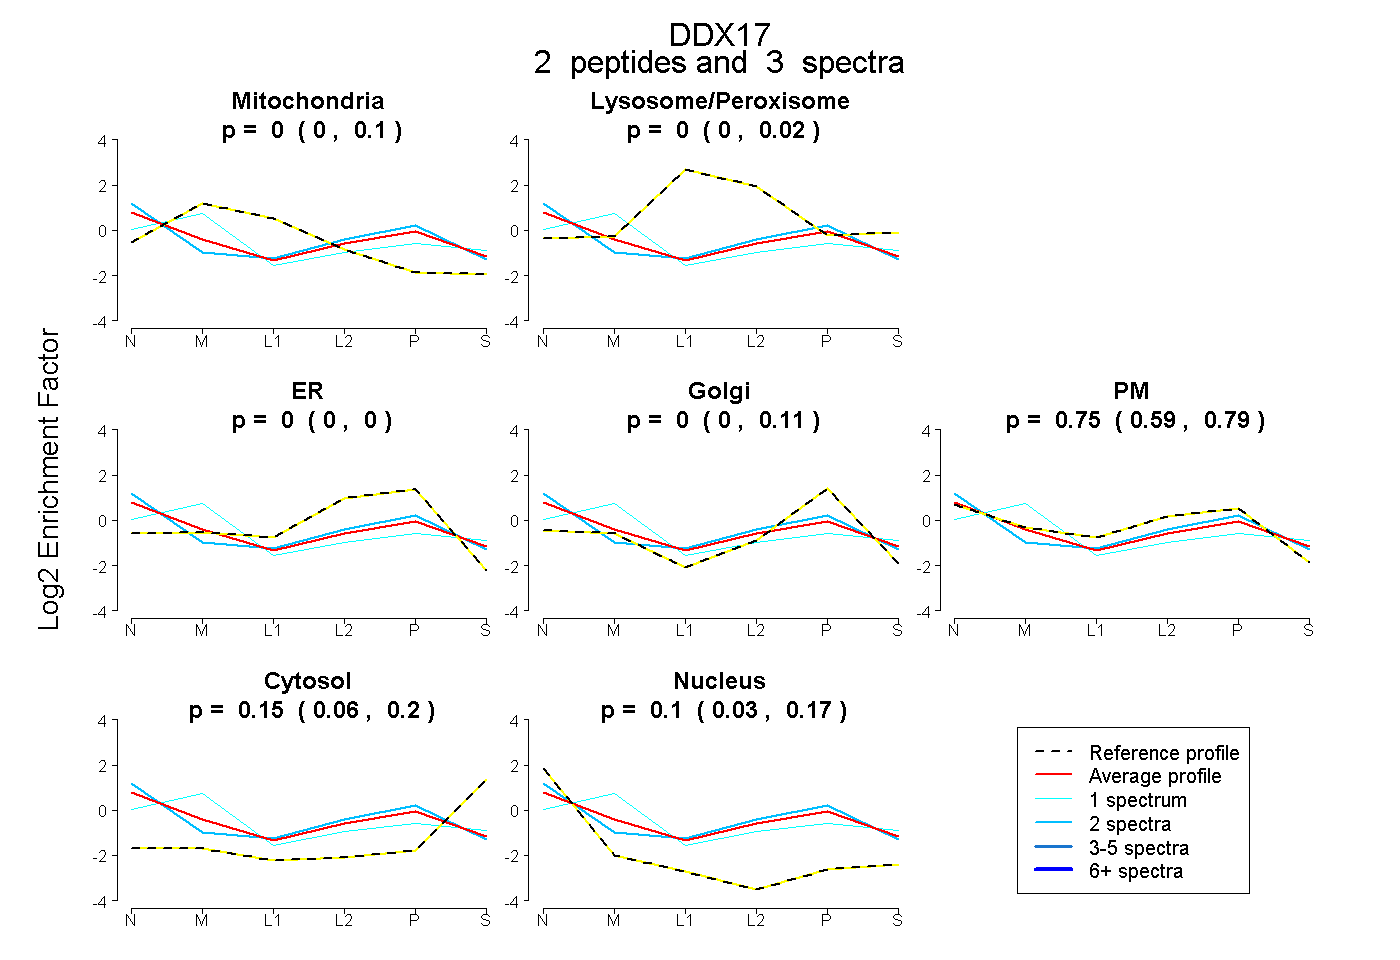
0.000 | 0.097
0.000 | 0.019
0.000 | 0.000
0.000 | 0.107
0.586 | 0.788
0.056 | 0.203
0.028 | 0.167
1peptide
spectrum
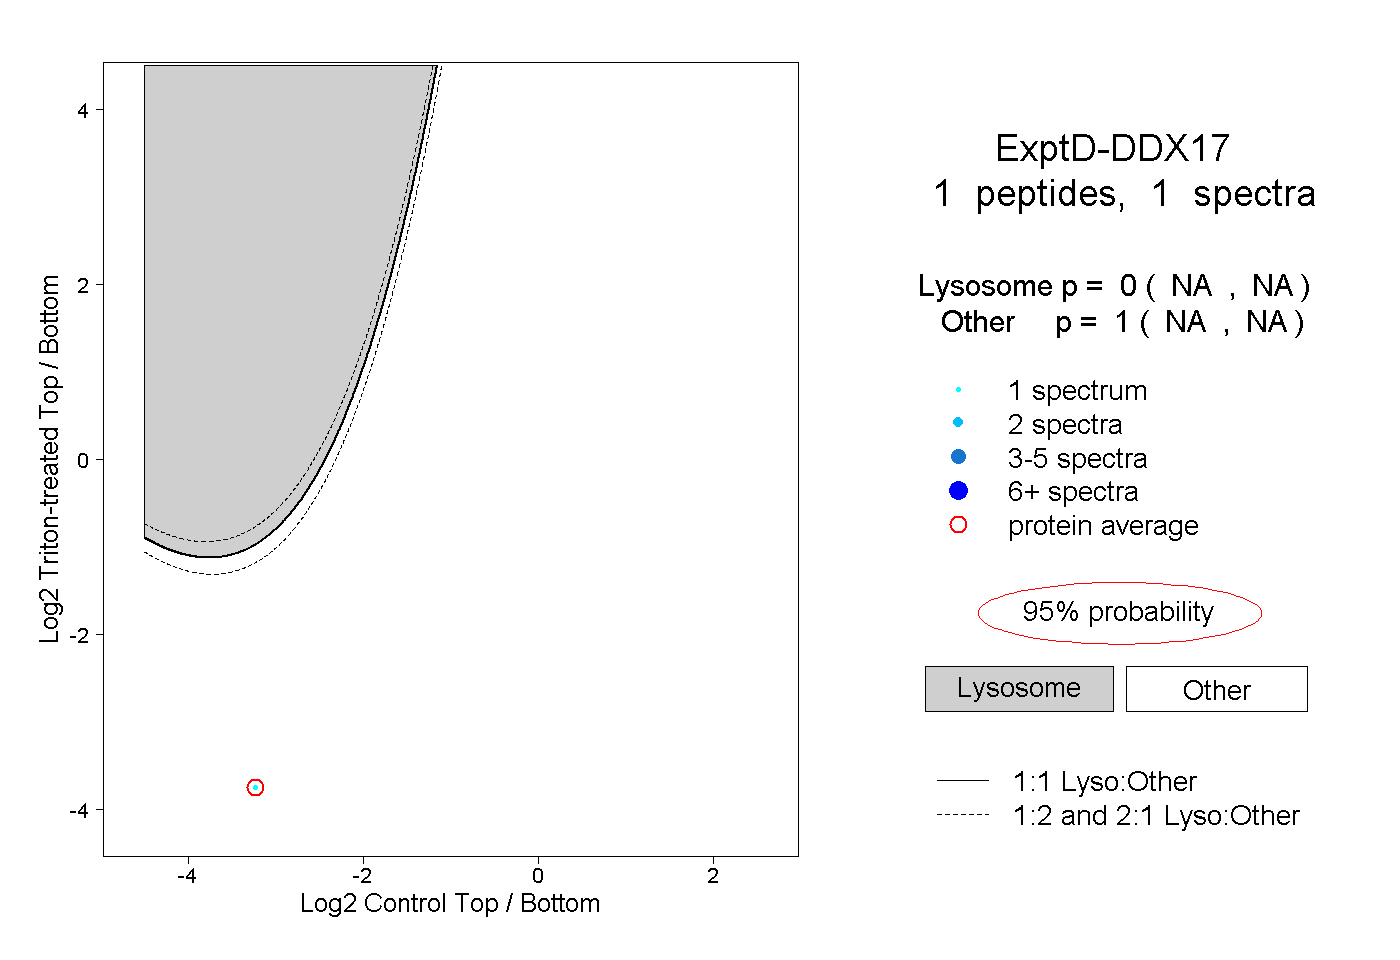
NA | NA
NA | NA