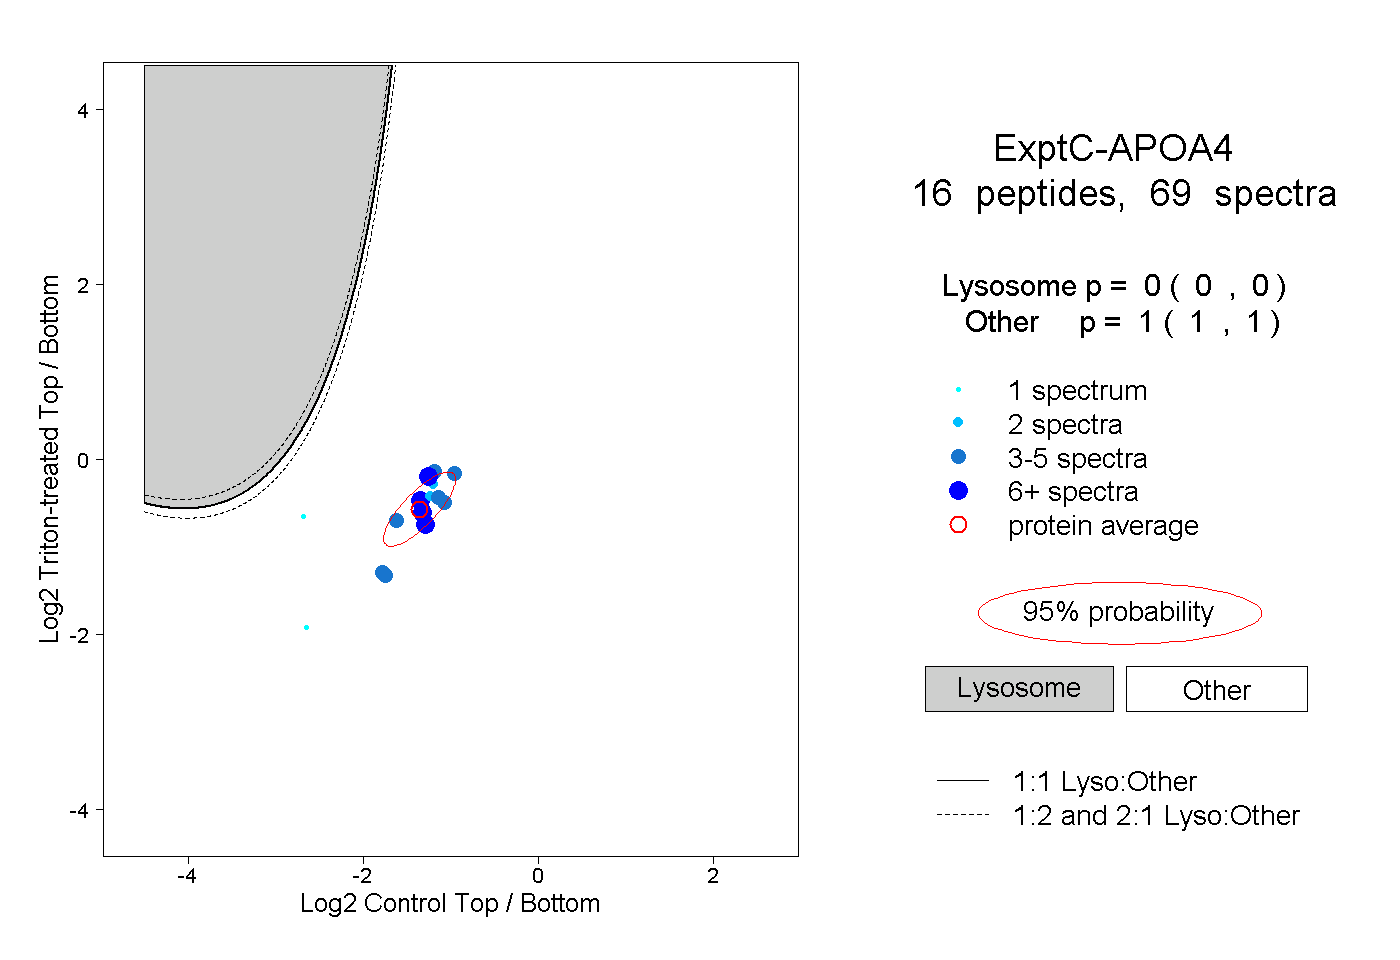
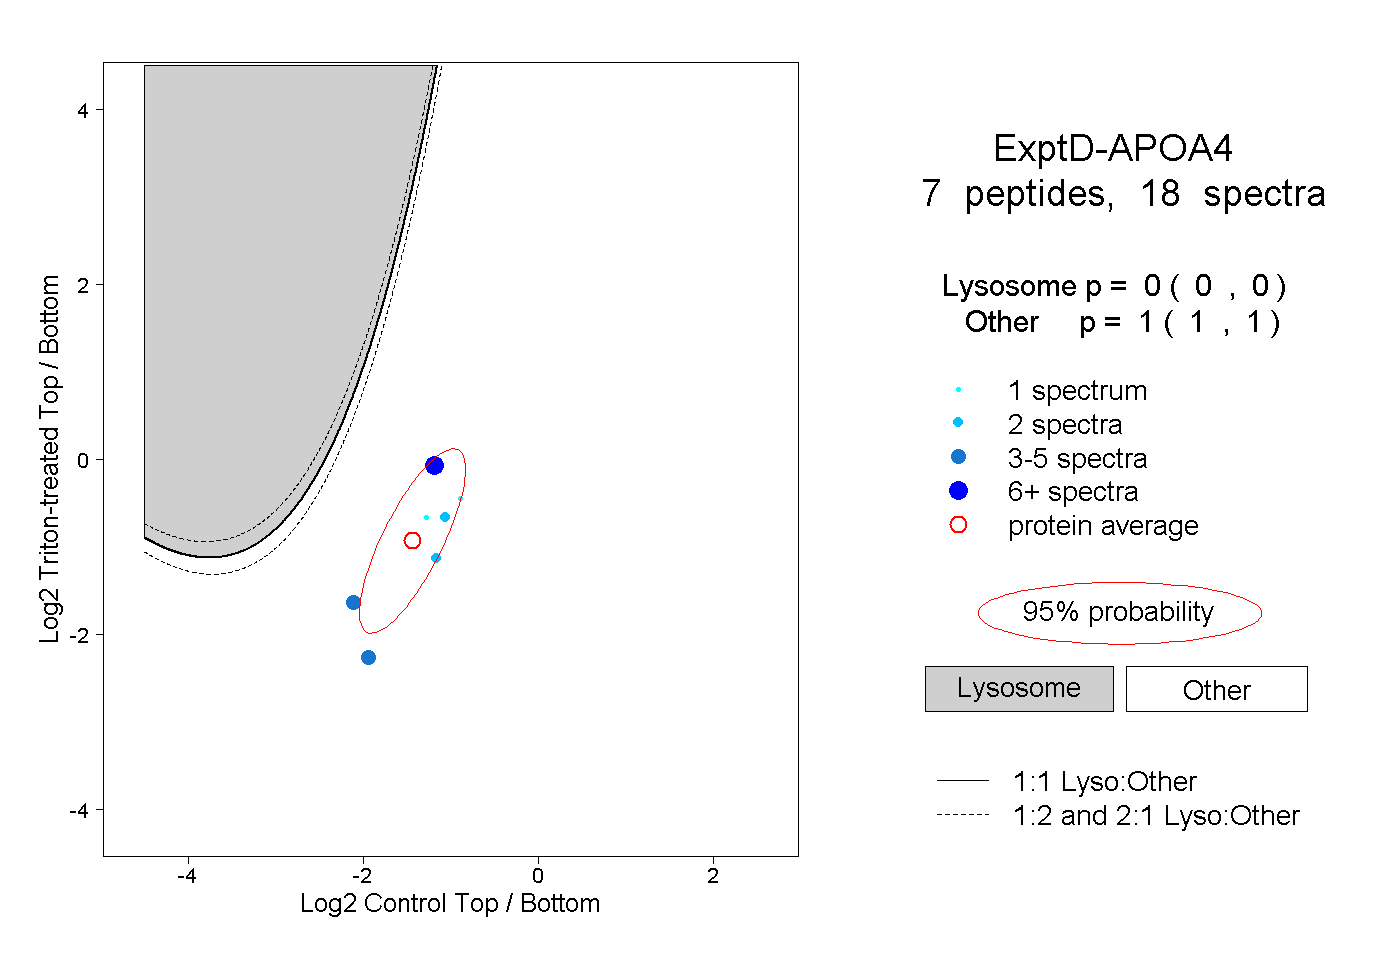
APOA4
[ENSRNOP00000065704]
Main page
| | | Plot |
Mito |
Lyso |
|
Perox |
ER |
Golgi |
PM |
Cytosol |
Nucleus |
|
| Expt A |
 12
12
peptides |
35
spectra |
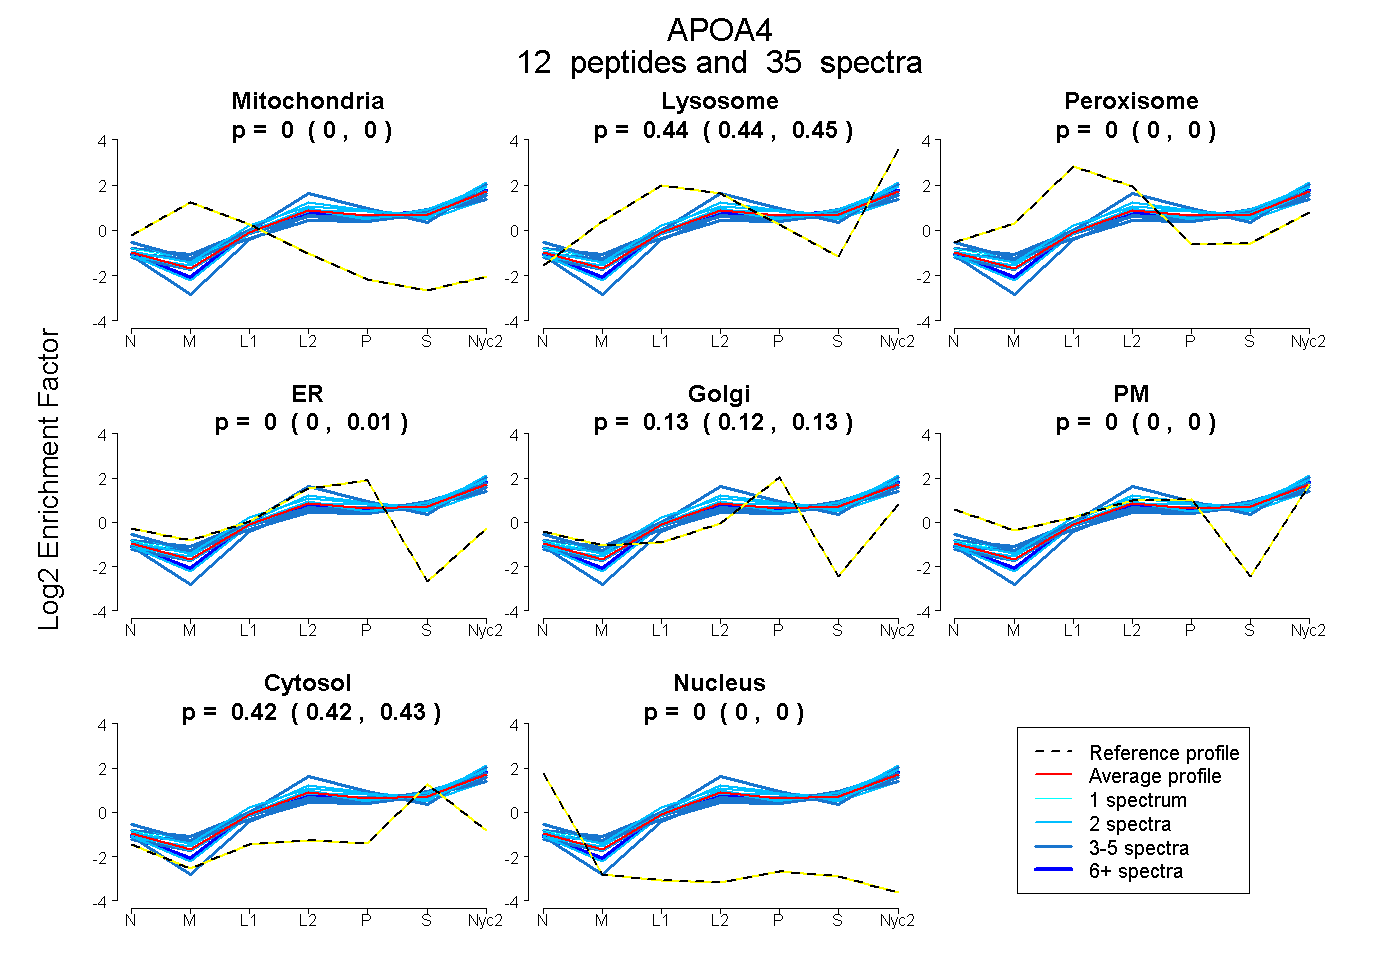 |
0.000
0.000 | 0.000 |
0.443
0.438 | 0.447 |
|
0.000
0.000 | 0.000 |
0.003
0.000 | 0.014 |
0.129
0.115 | 0.135 |
0.000
0.000 | 0.000 |
0.425
0.421 | 0.428 |
0.000
0.000 | 0.000 |
|
| | | Plot |
Mito |
|
Lyso or Perox |
|
ER |
Golgi |
PM |
Cytosol |
Nucleus |
|
| Expt B |
6
peptides |
14
spectra |
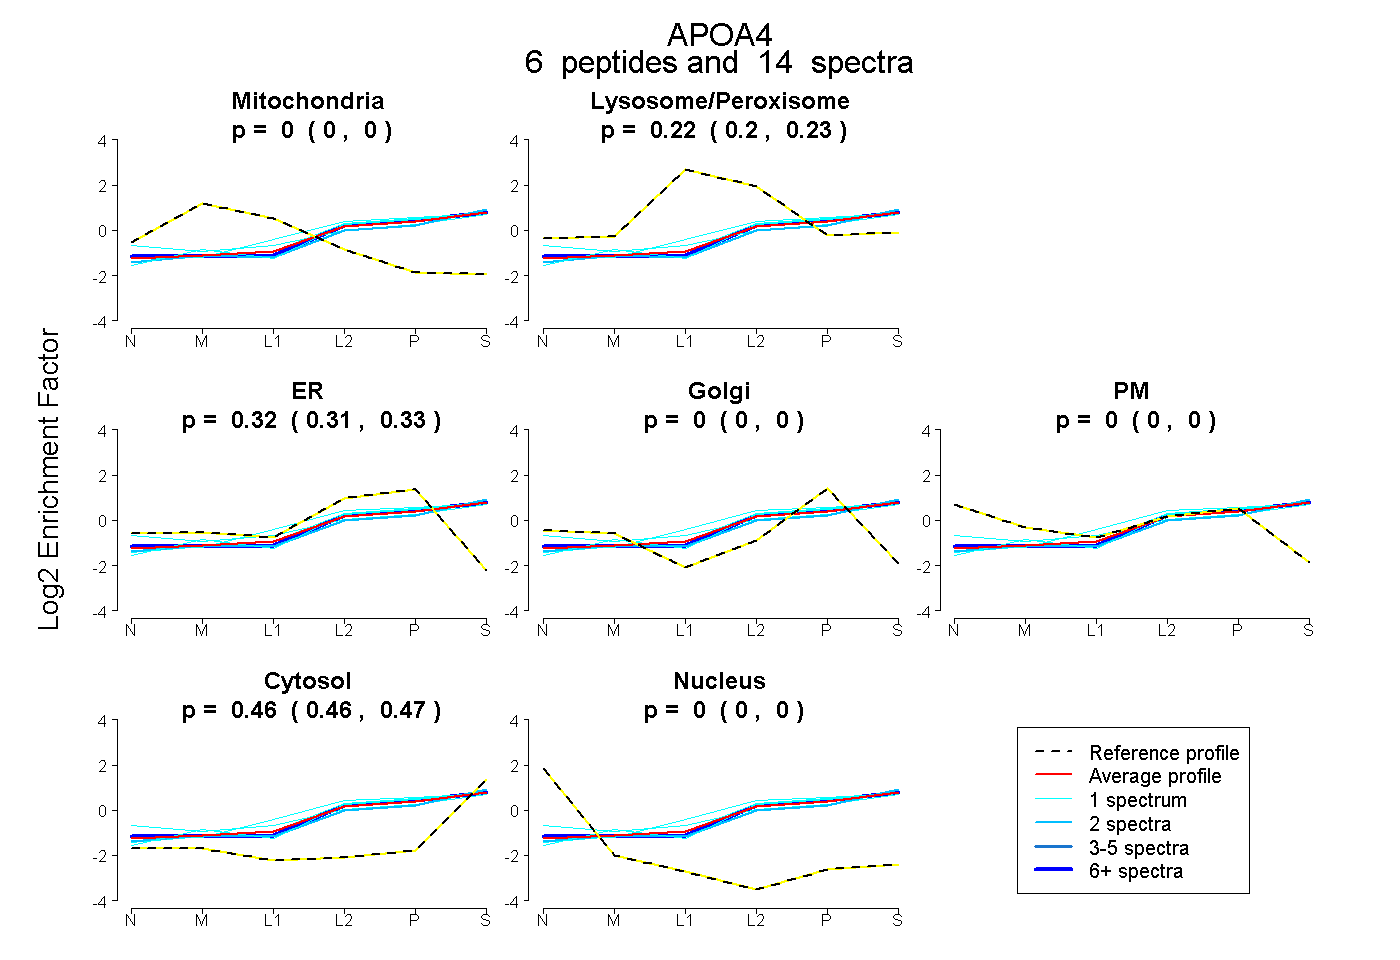 |
0.000
0.000 | 0.000 |
|
0.218
0.204 | 0.229 |
|
0.319
0.309 | 0.328 |
0.000
0.000 | 0.000 |
0.000
0.000 | 0.000 |
0.463
0.457 | 0.468 |
0.000
0.000 | 0.000 |
|
| 1 spectrum, QLDQQVEVFR |
0.000 |
|
0.364 |
|
0.000 |
0.266 |
0.000 |
0.370 |
0.000 |
|
| 2 spectra, QLTPYIQR |
0.000 |
|
0.181 |
|
0.293 |
0.000 |
0.000 |
0.525 |
0.000 |
|
| 1 spectrum, SLEDLNK |
0.000 |
|
0.150 |
|
0.383 |
0.000 |
0.000 |
0.467 |
0.000 |
|
| 8 spectra, ATIDQNLEDLR |
0.000 |
|
0.185 |
|
0.347 |
0.000 |
0.000 |
0.468 |
0.000 |
|
| 1 spectrum, LAPLAEGVQEK |
0.000 |
|
0.213 |
|
0.335 |
0.000 |
0.000 |
0.452 |
0.000 |
|
| 1 spectrum, NAEELQTK |
0.000 |
|
0.313 |
|
0.291 |
0.000 |
0.000 |
0.396 |
0.000 |
|
| | | Plot |
|
Lyso |
|
|
|
|
|
|
|
Other |
| Expt C |
16
peptides |
69
spectra |
 |
|
0.000
0.000 | 0.000 |
|
|
|
|
|
|
|
1.000
1.000 | 1.000 |
| | | Plot |
|
Lyso |
|
|
|
|
|
|
|
Other |
| Expt D |
7
peptides |
18
spectra |
 |
|
0.000
0.000 | 0.000 |
|
|
|
|
|
|
|
1.000
1.000 | 1.000 |