9
9peptides
spectra
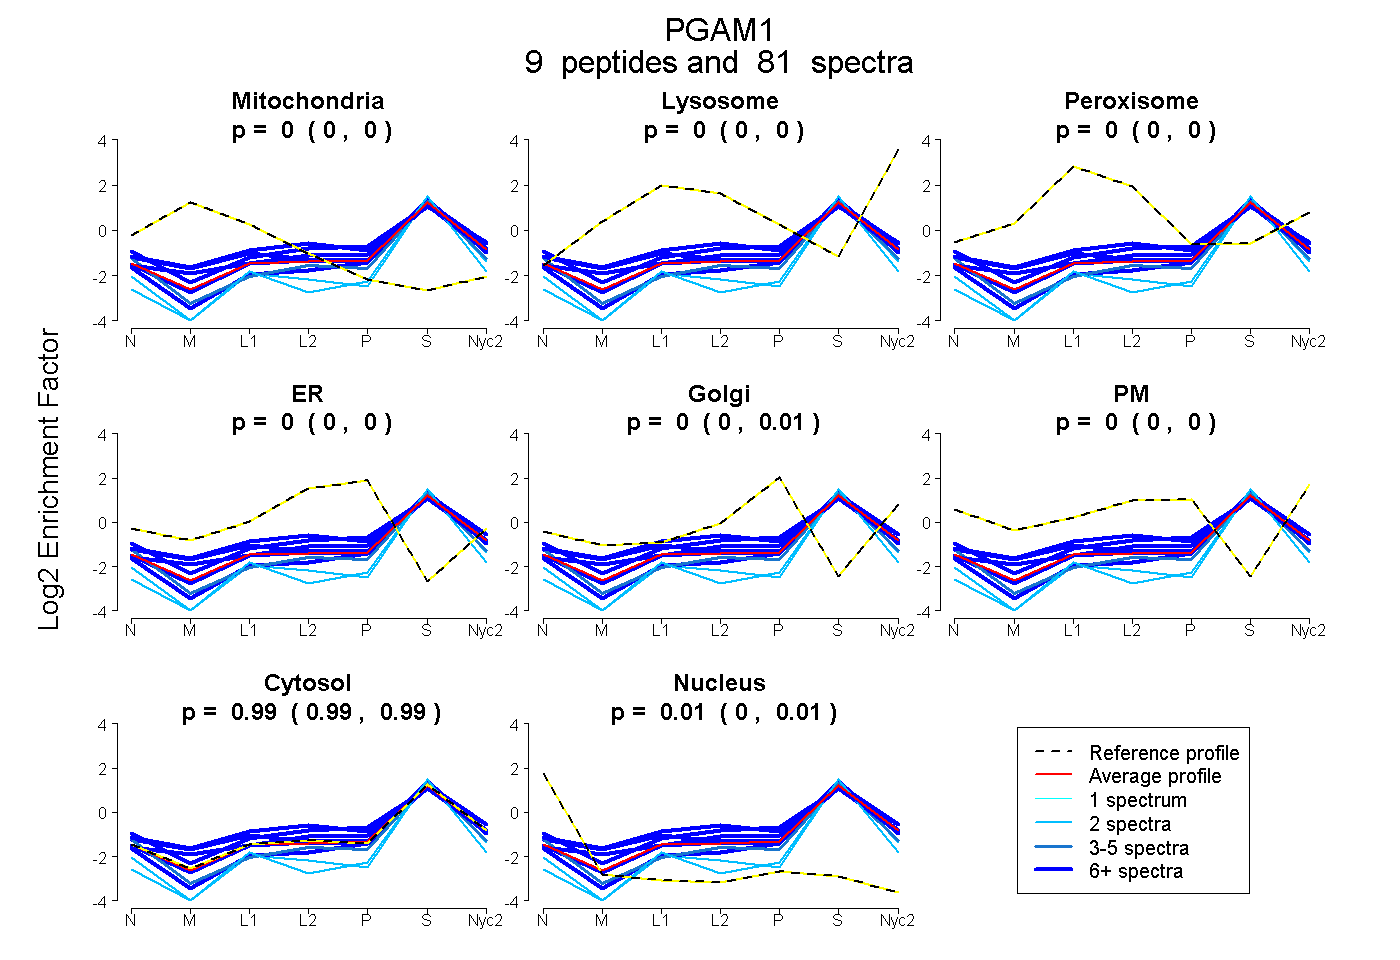
0.000 | 0.000
0.000 | 0.000
0.000 | 0.000
0.000 | 0.000
0.000 | 0.006
0.000 | 0.000
0.987 | 0.994
0.003 | 0.010
5peptides
spectra
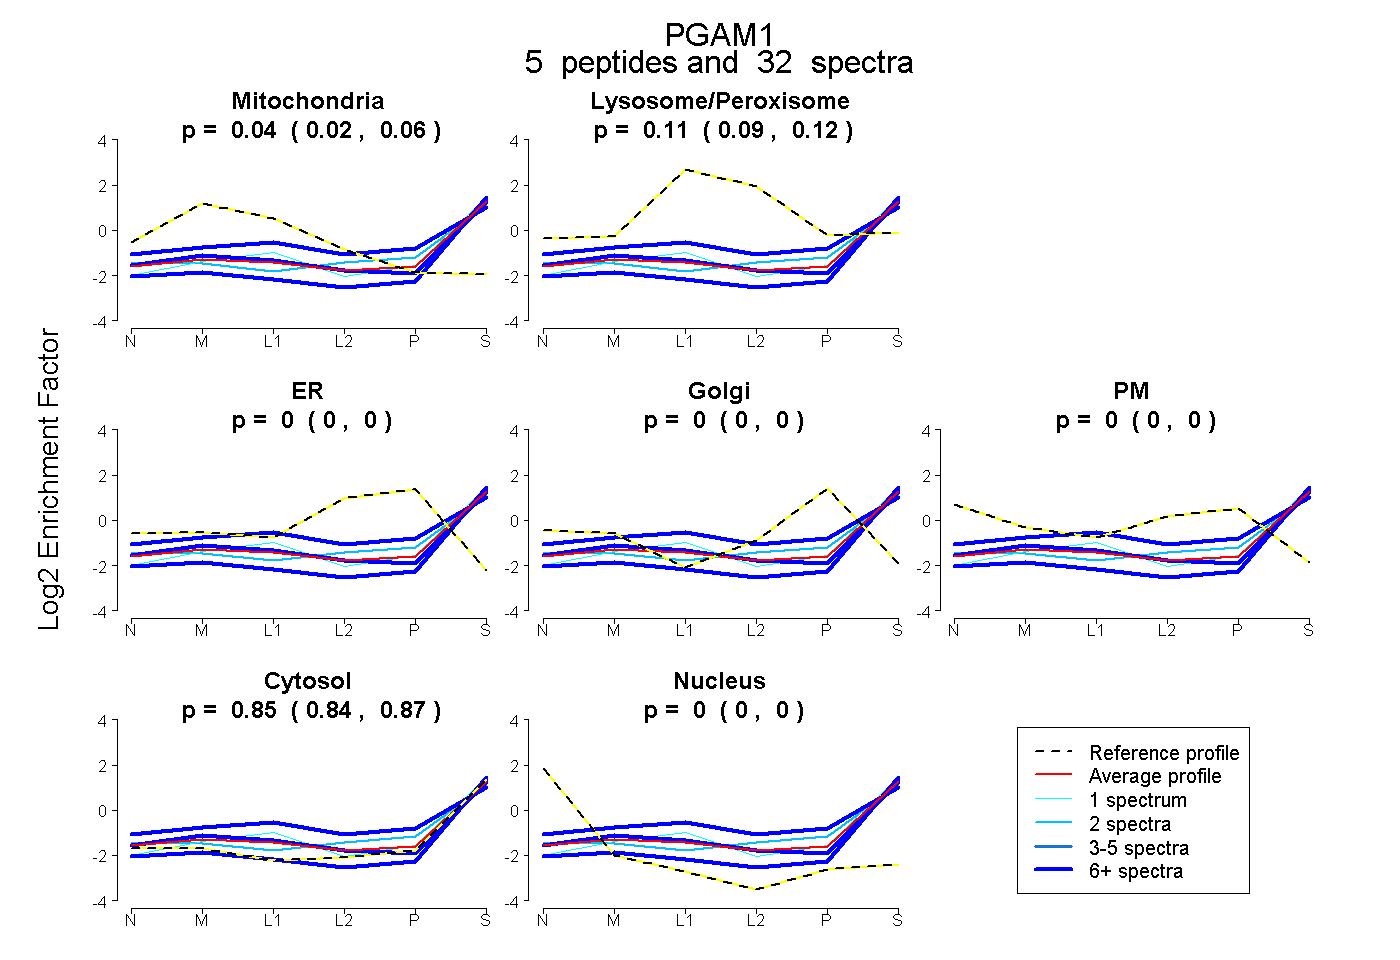
0.021 | 0.058
0.085 | 0.124
0.000 | 0.000
0.000 | 0.000
0.000 | 0.000
0.839 | 0.866
0.000 | 0.000