 9
9peptides
spectra
0.000 | 0.000
0.000 | 0.000
0.000 | 0.000
0.000 | 0.000
0.000 | 0.006
0.000 | 0.000
0.987 | 0.994
0.003 | 0.010
| Plot | Mito | Lyso | Perox | ER | Golgi | PM | Cytosol | Nucleus | |||||
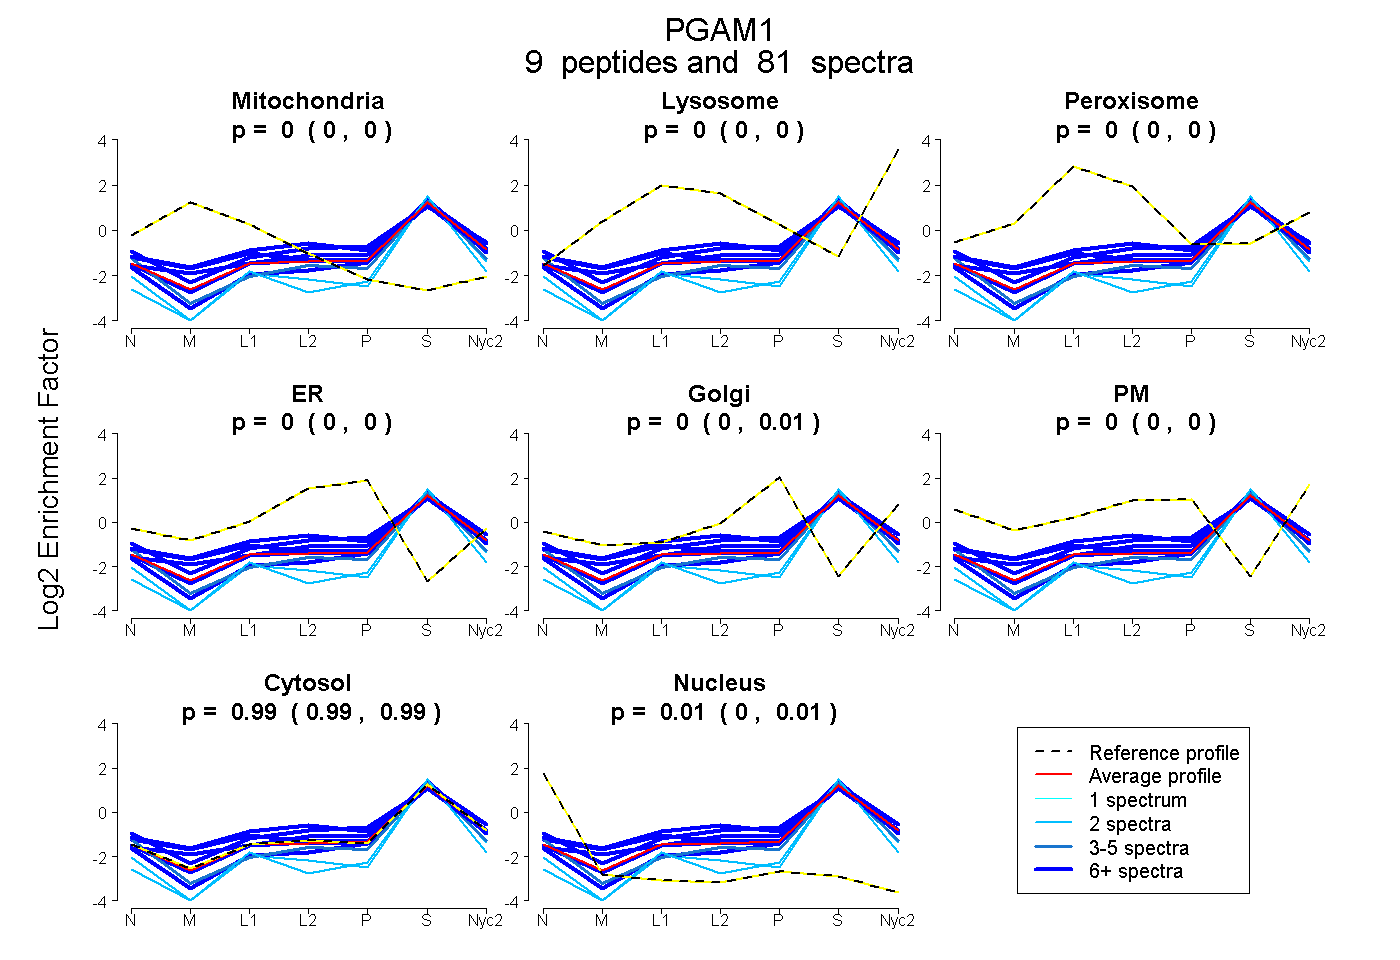
| Expt A |
9 peptides |
81 spectra |
|
0.000 0.000 | 0.000 |
0.000 0.000 | 0.000 |
0.000 0.000 | 0.000 |
0.000 0.000 | 0.000 |
0.001 0.000 | 0.006 |
0.000 0.000 | 0.000 |
0.992 0.987 | 0.994 |
0.007 0.003 | 0.010 |
| 6 spectra, HYGGLTGLNK | 0.042 | 0.008 | 0.000 | 0.025 | 0.021 | 0.000 | 0.904 | 0.000 | ||
| 8 spectra, HGESAWNLENR | 0.000 | 0.000 | 0.008 | 0.132 | 0.000 | 0.000 | 0.860 | 0.000 | ||
| 3 spectra, HGEAQVK | 0.000 | 0.000 | 0.000 | 0.000 | 0.000 | 0.000 | 0.914 | 0.086 | ||
| 11 spectra, AMEAVAAQGK | 0.000 | 0.005 | 0.000 | 0.000 | 0.000 | 0.000 | 0.995 | 0.000 | ||
| 2 spectra, ALPFWNEEIVPQIK | 0.000 | 0.000 | 0.000 | 0.000 | 0.000 | 0.000 | 0.933 | 0.067 | ||
| 12 spectra, AETAAK | 0.092 | 0.004 | 0.050 | 0.000 | 0.000 | 0.000 | 0.854 | 0.000 | ||
| 6 spectra, GGQALR | 0.000 | 0.000 | 0.000 | 0.000 | 0.000 | 0.000 | 0.971 | 0.029 | ||
| 2 spectra, SYDVPPPPMEPDHPFYSNISK | 0.000 | 0.000 | 0.000 | 0.000 | 0.000 | 0.000 | 0.935 | 0.065 | ||
| 31 spectra, VLIAAHGNSLR | 0.000 | 0.000 | 0.165 | 0.013 | 0.041 | 0.000 | 0.781 | 0.000 |
| Plot | Mito | Lyso or Perox | ER | Golgi | PM | Cytosol | Nucleus | ||||||
| Expt B |
5 peptides |
32 spectra |
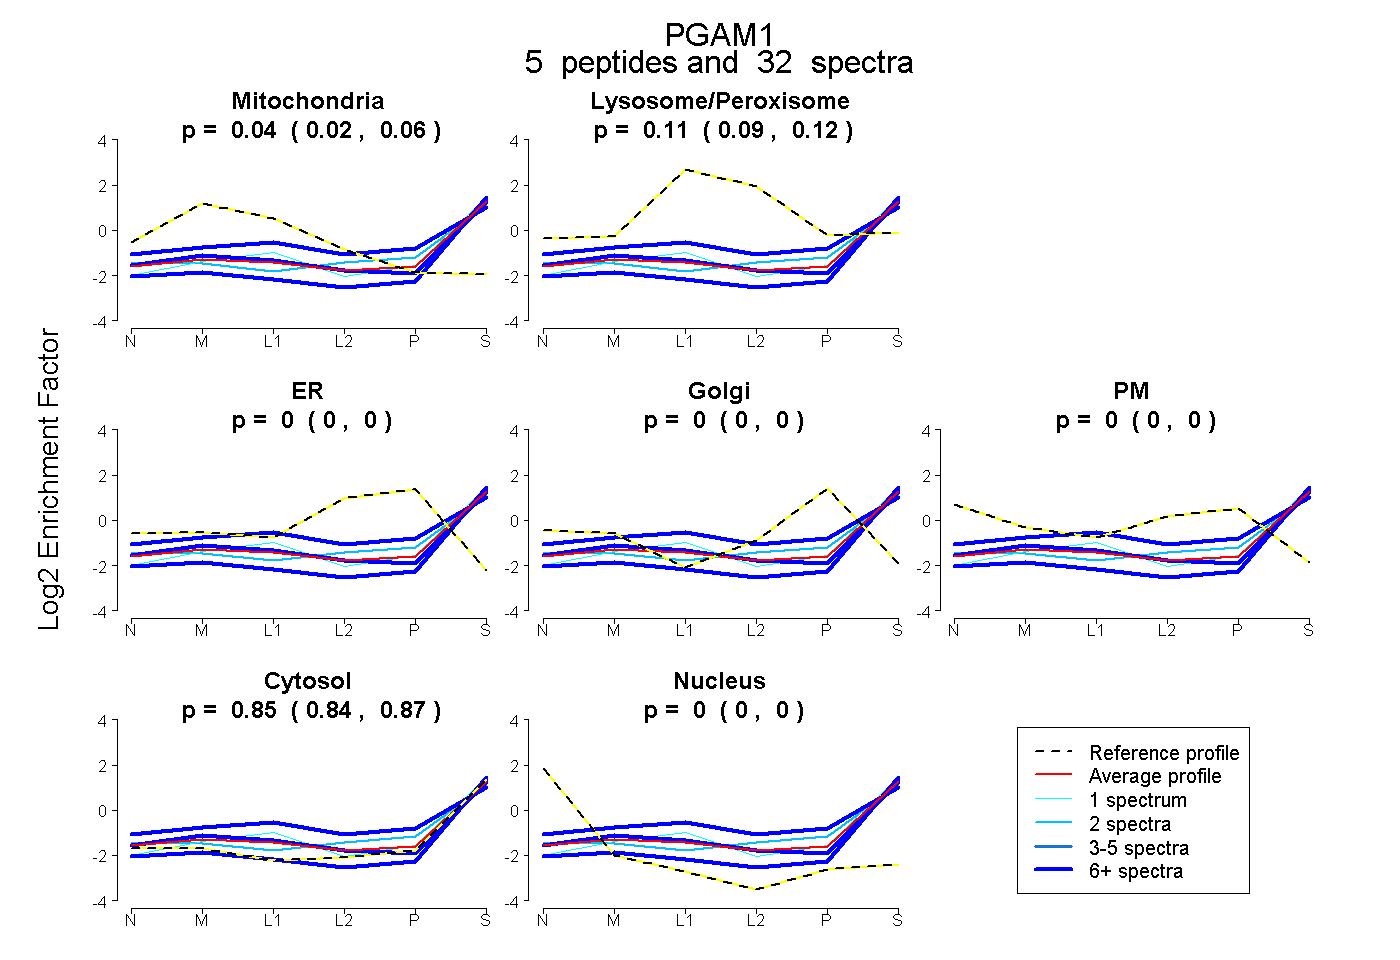 |
0.040 0.021 | 0.058 |
0.106 0.085 | 0.124 |
0.000 0.000 | 0.000 |
0.000 0.000 | 0.000 |
0.000 0.000 | 0.000 |
0.853 0.839 | 0.866 |
0.000 0.000 | 0.000 |
|||
| Plot | Lyso | Other | |||||||||||
| Expt C |
11 peptides |
110 spectra |
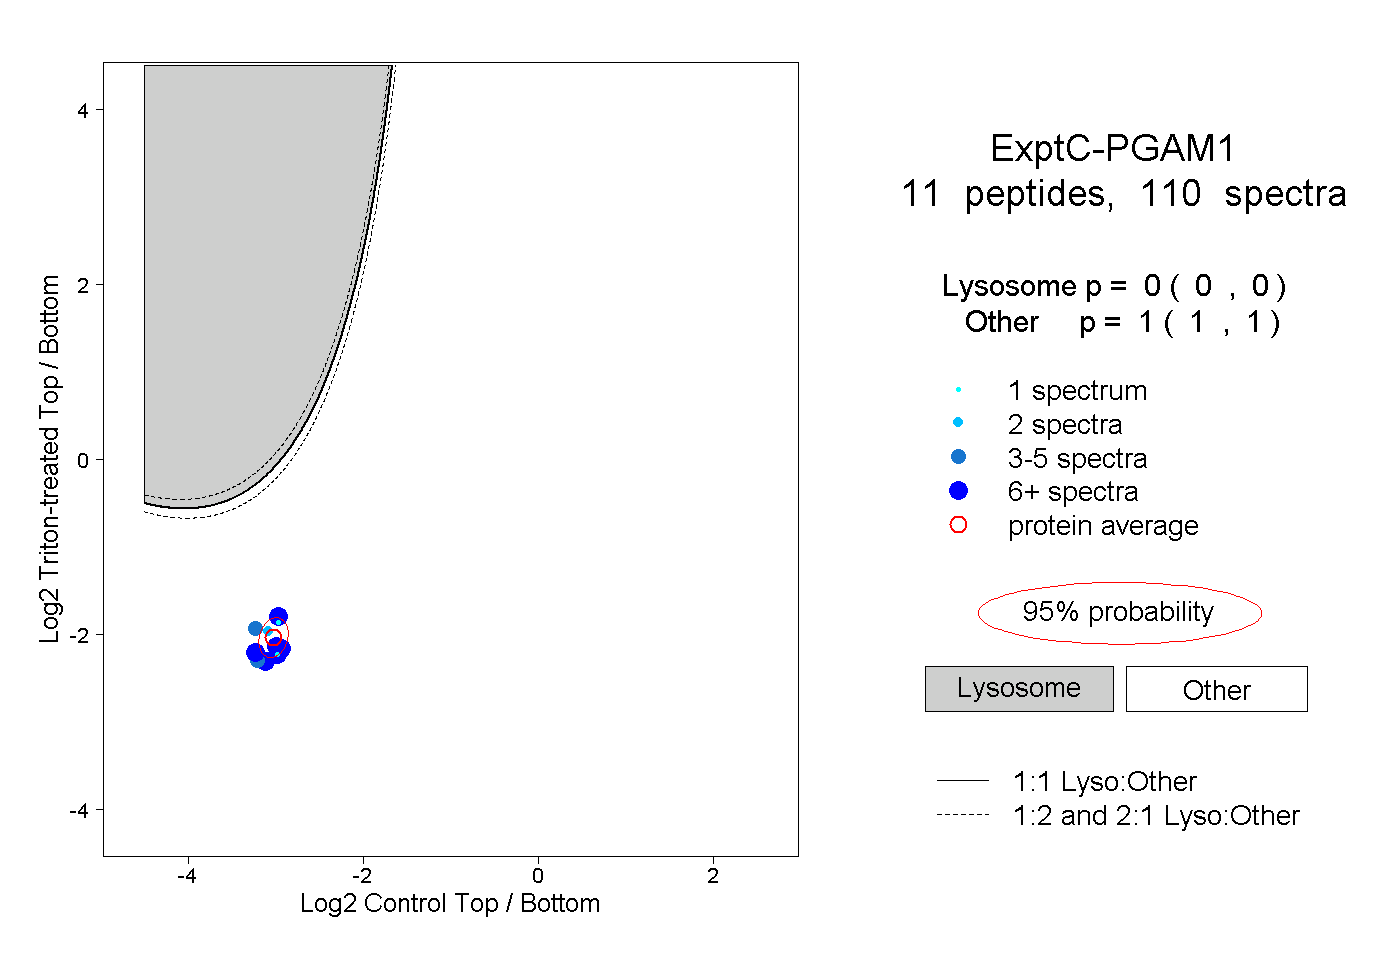 |
0.000 0.000 | 0.000 |
1.000 1.000 | 1.000 |
||||||||
| Plot | Lyso | Other | |||||||||||
| Expt D |
5 peptides |
8 spectra |
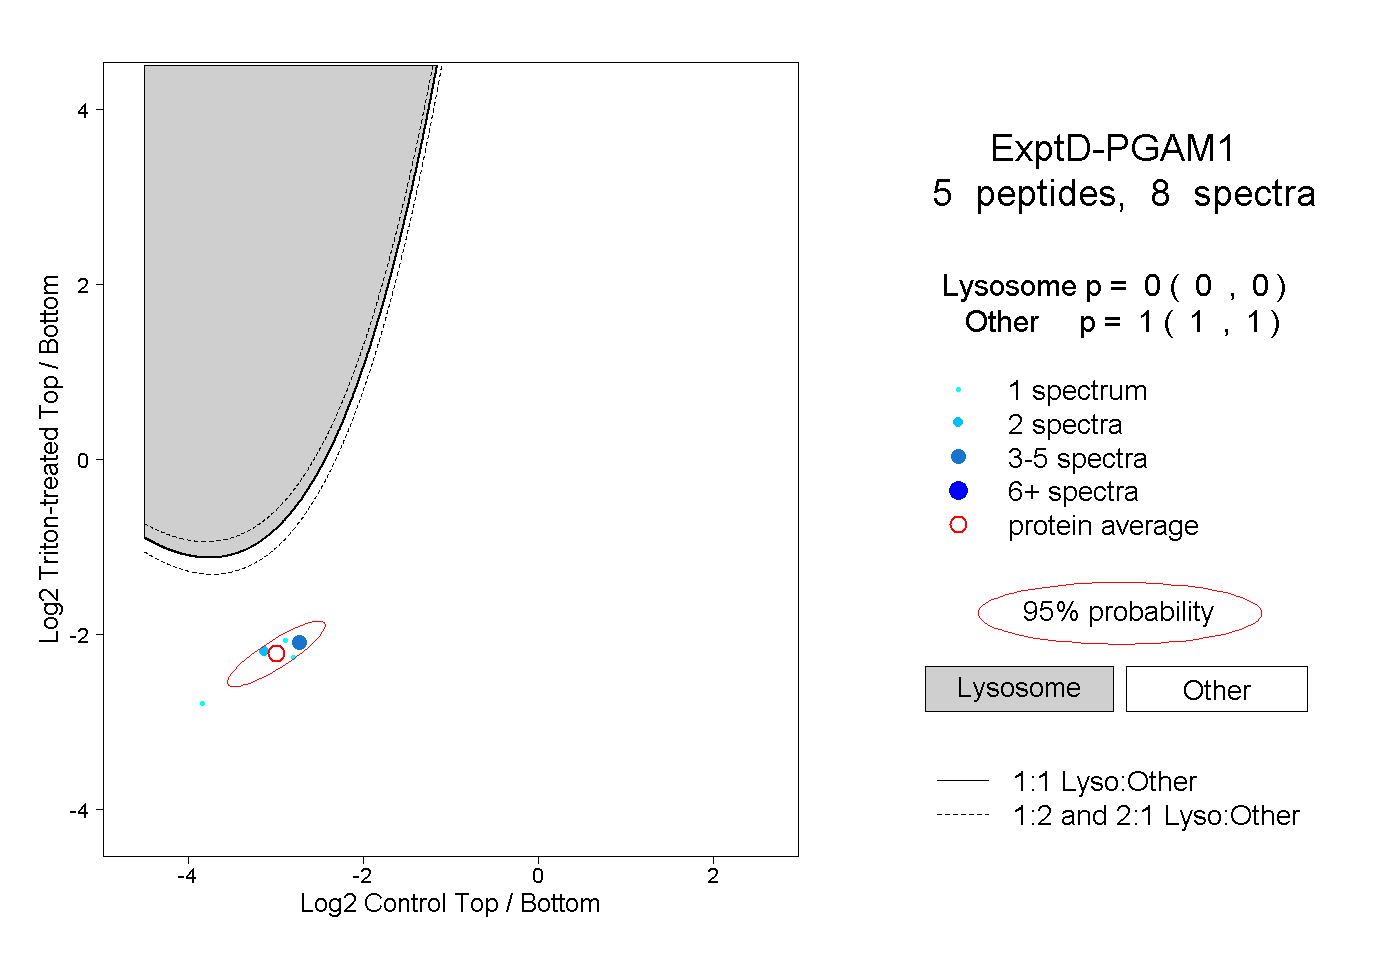 |
0.000 0.000 | 0.000 |
1.000 1.000 | 1.000 |