 4
4peptides
spectra
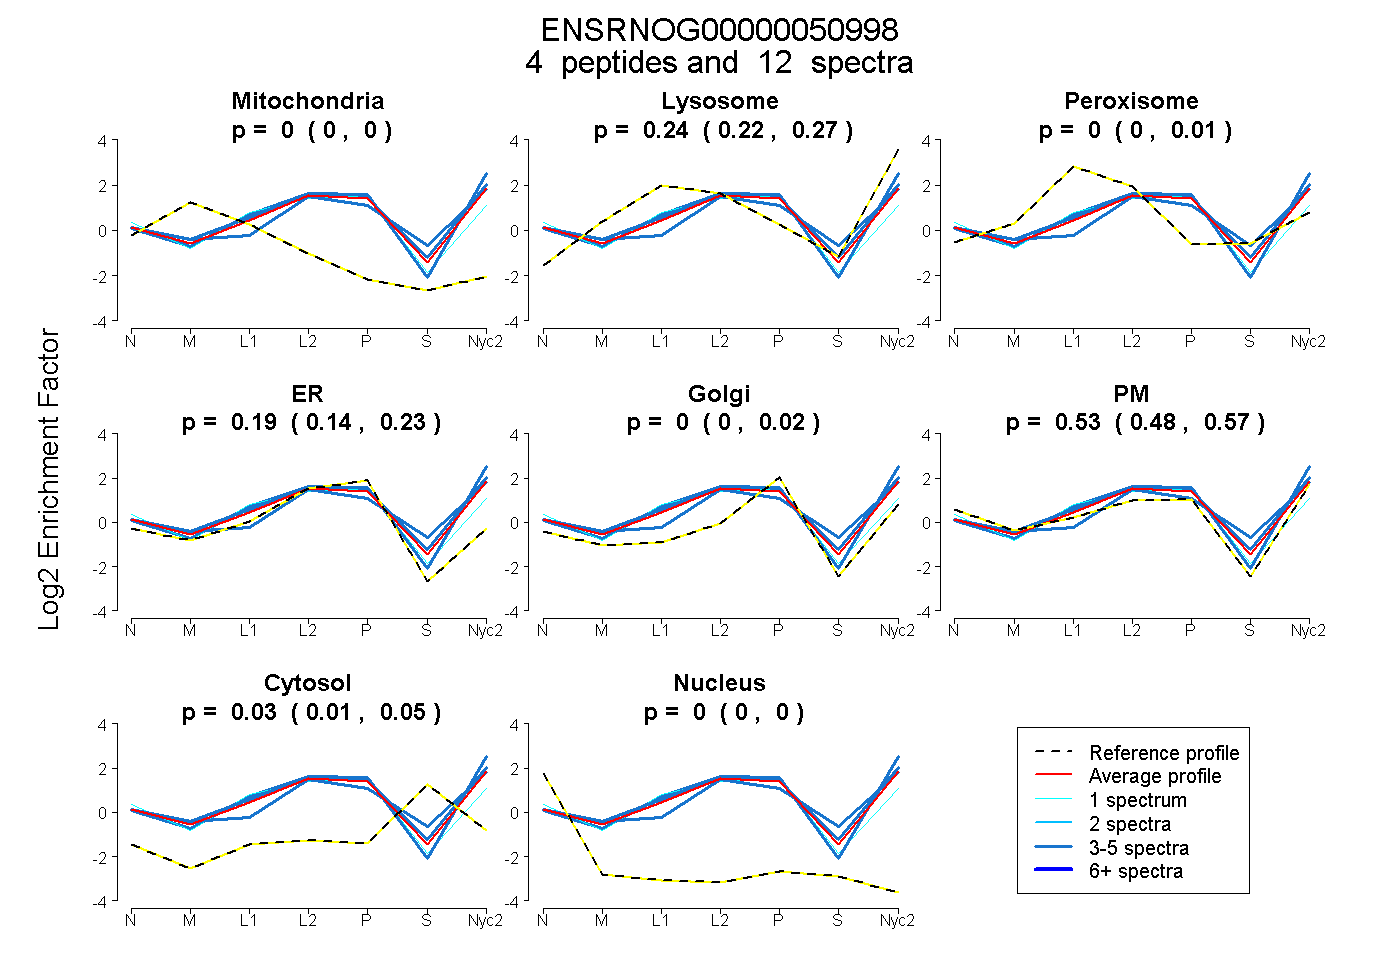
0.000 | 0.000
0.215 | 0.266
0.000 | 0.007
0.140 | 0.233
0.000 | 0.018
0.482 | 0.570
0.013 | 0.049
0.000 | 0.000
1peptide
spectrum
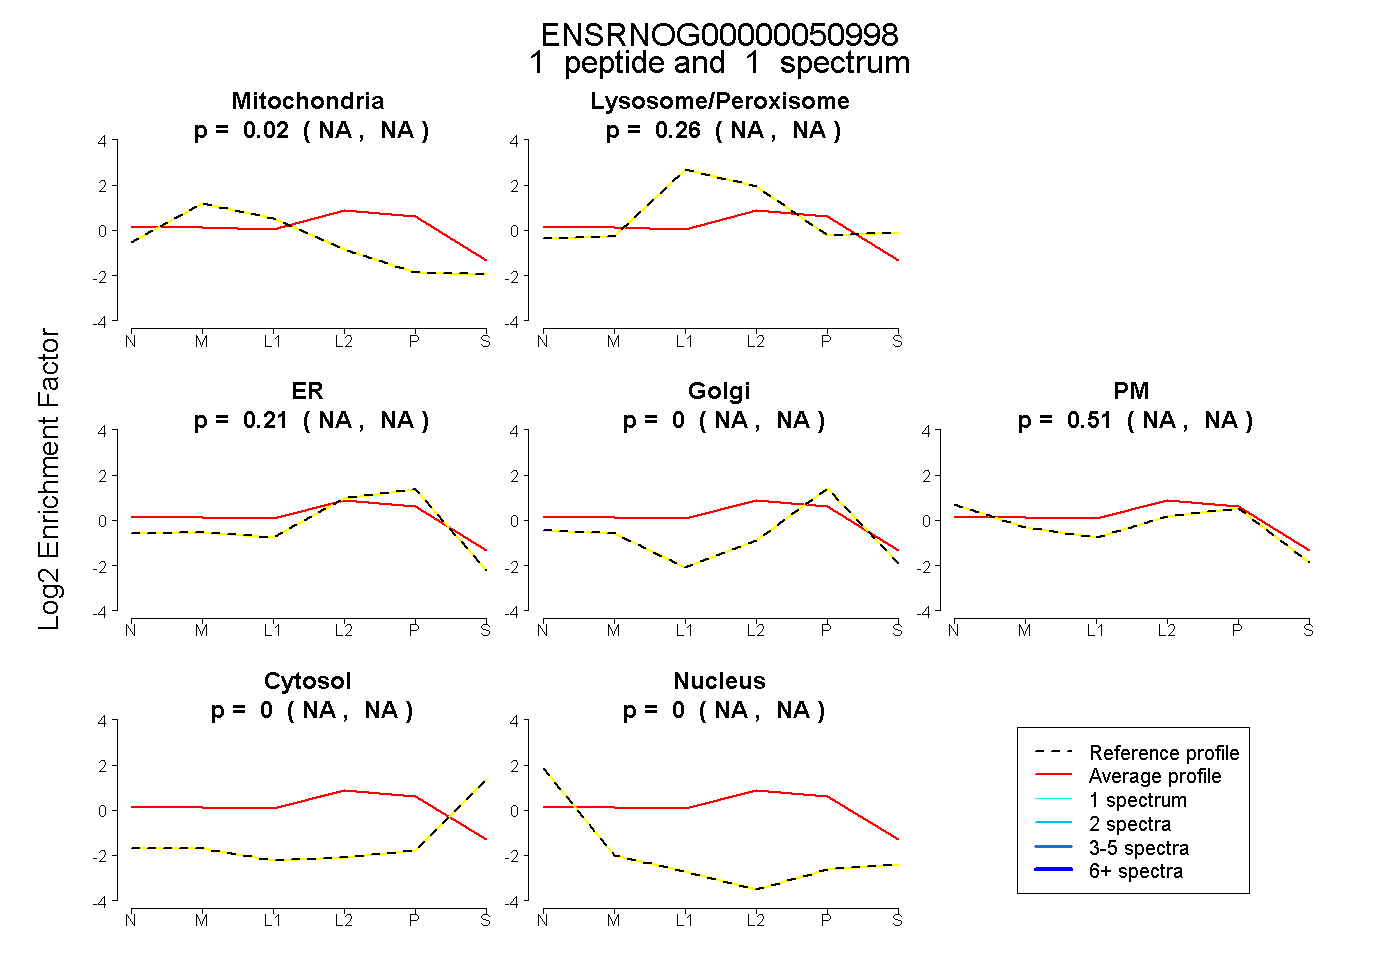
NA | NA
NA | NA
NA | NA
NA | NA
NA | NA
NA | NA
NA | NA
2peptides
spectra
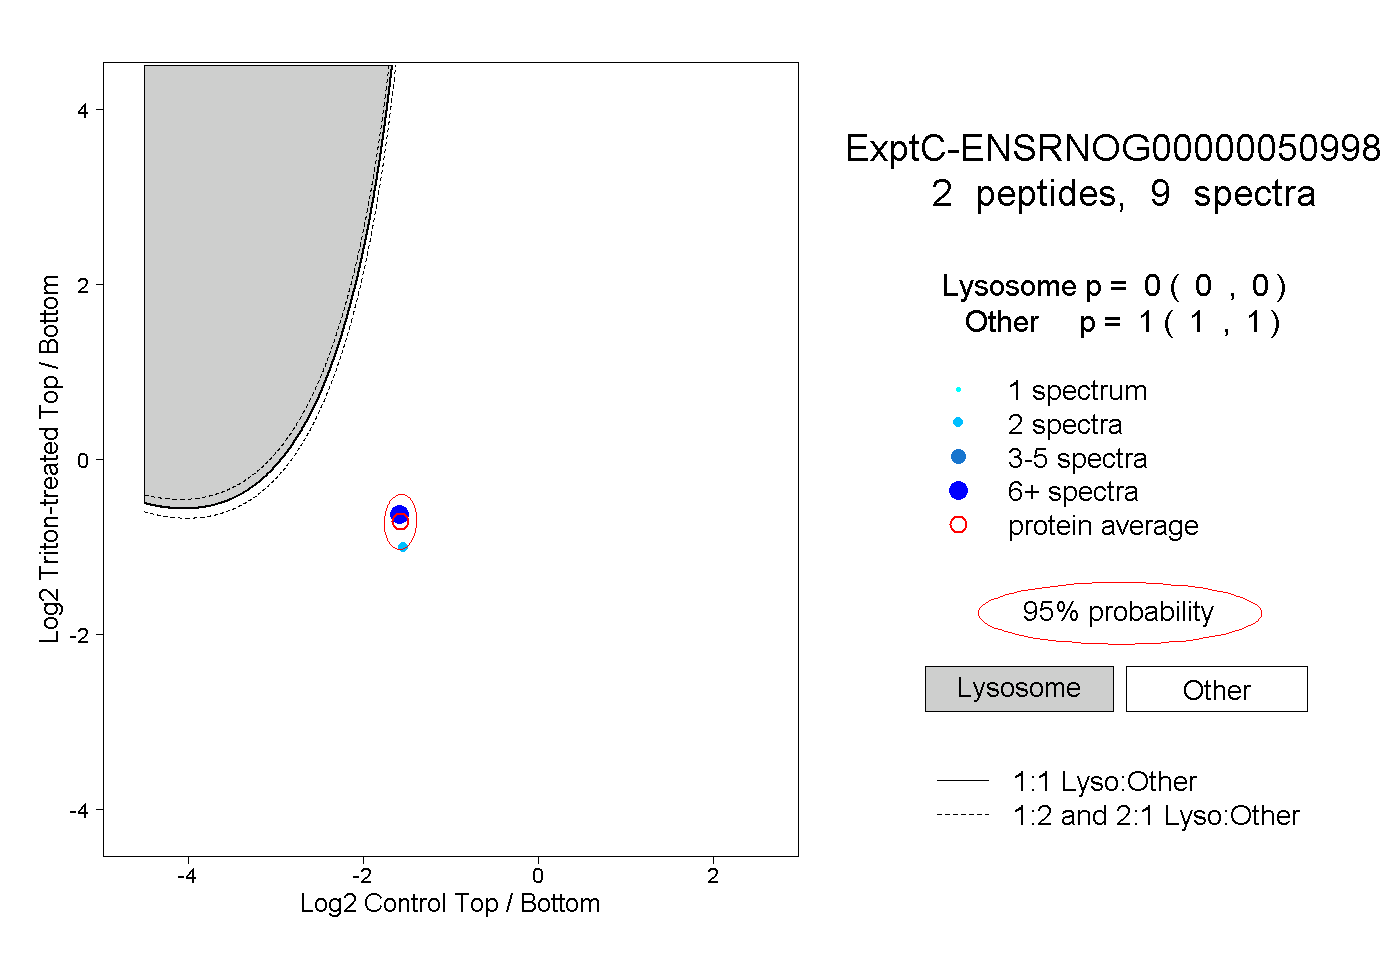
0.000 | 0.000
1.000 | 1.000
1peptide
spectra
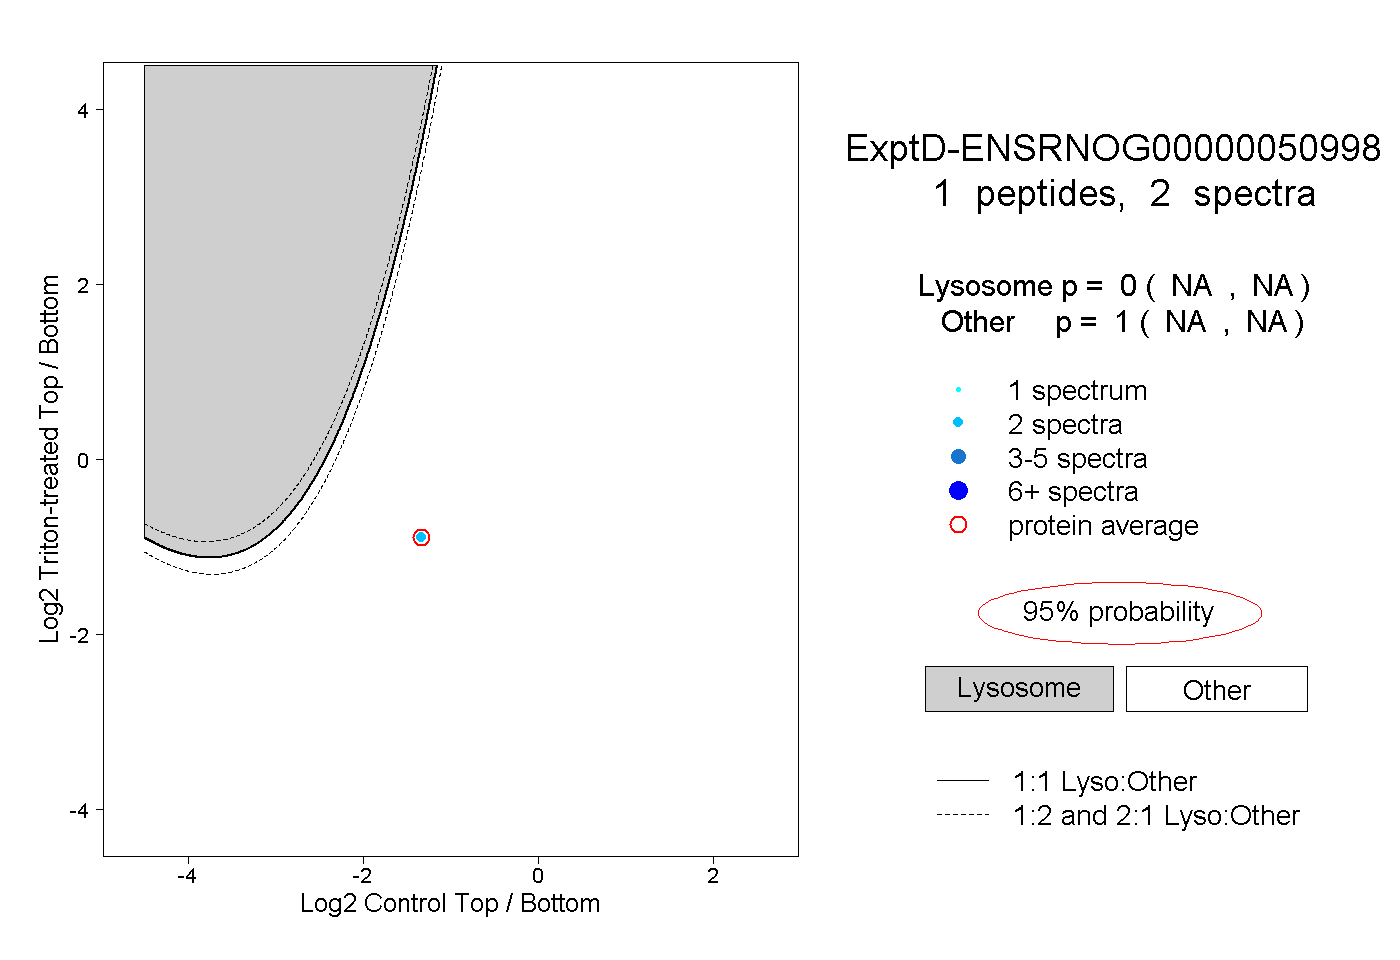
NA | NA
NA | NA