 2
2peptides
spectra
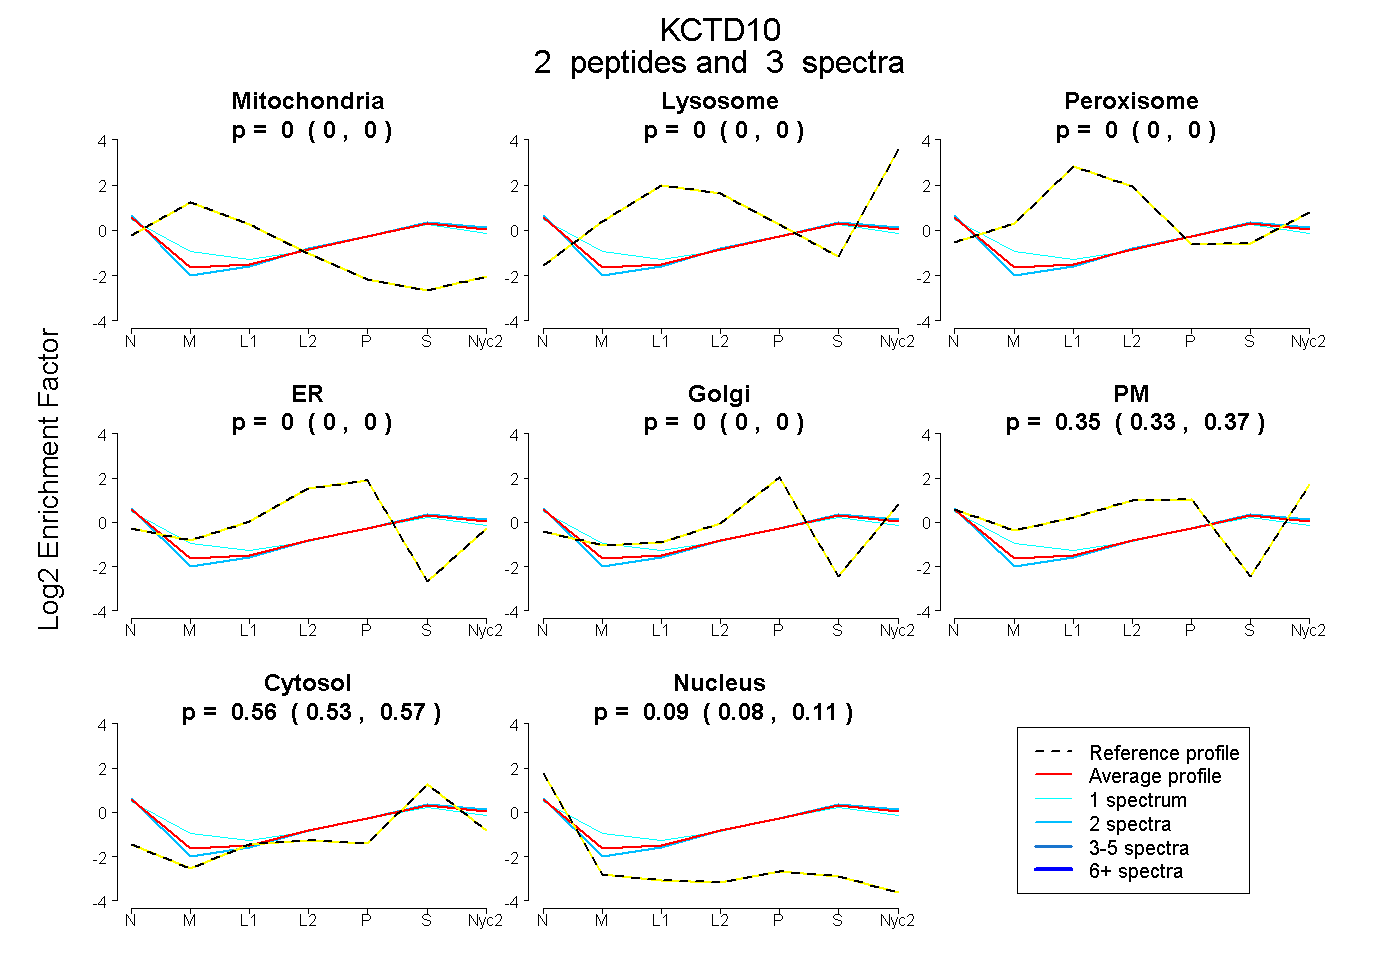
0.000 | 0.000
0.000 | 0.000
0.000 | 0.000
0.000 | 0.000
0.000 | 0.000
0.327 | 0.369
0.535 | 0.574
0.080 | 0.106
| Plot | Mito | Lyso | Perox | ER | Golgi | PM | Cytosol | Nucleus | |||||
| Expt A |
2 peptides |
3 spectra |
|
0.000 0.000 | 0.000 |
0.000 0.000 | 0.000 |
0.000 0.000 | 0.000 |
0.000 0.000 | 0.000 |
0.000 0.000 | 0.000 |
0.349 0.327 | 0.369 |
0.556 0.535 | 0.574 |
0.095 0.080 | 0.106 |
| 1 spectrum, HFGTILNYLR | 0.008 | 0.000 | 0.000 | 0.000 | 0.000 | 0.379 | 0.523 | 0.090 | ||
| 2 spectra, NIELFDK | 0.000 | 0.000 | 0.000 | 0.000 | 0.000 | 0.332 | 0.572 | 0.095 |
| Plot | Lyso | Other | |||||||||||
| Expt C |
2 peptides |
5 spectra |
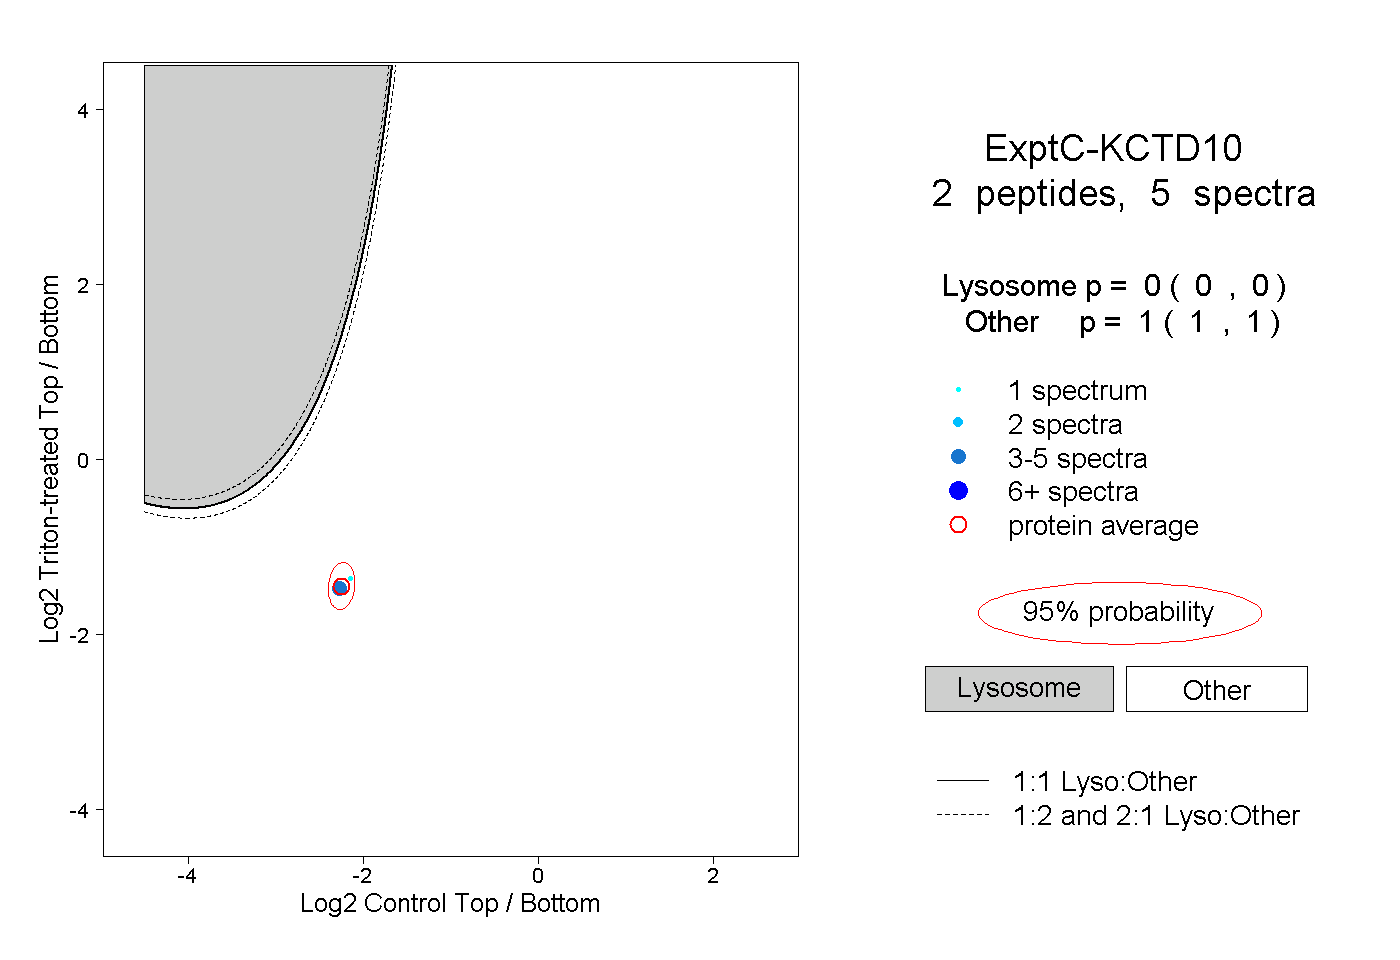 |
0.000 0.000 | 0.000 |
1.000 1.000 | 1.000 |