 2
2peptides
spectra
0.000 | 0.000
0.318 | 0.505
0.000 | 0.033
0.000 | 0.000
0.000 | 0.043
0.040 | 0.198
0.366 | 0.491
0.000 | 0.000
1peptide
spectra
0.960 | 0.998
0.002 | 0.039
| Plot | Mito | Lyso | Perox | ER | Golgi | PM | Cytosol | Nucleus | |||||
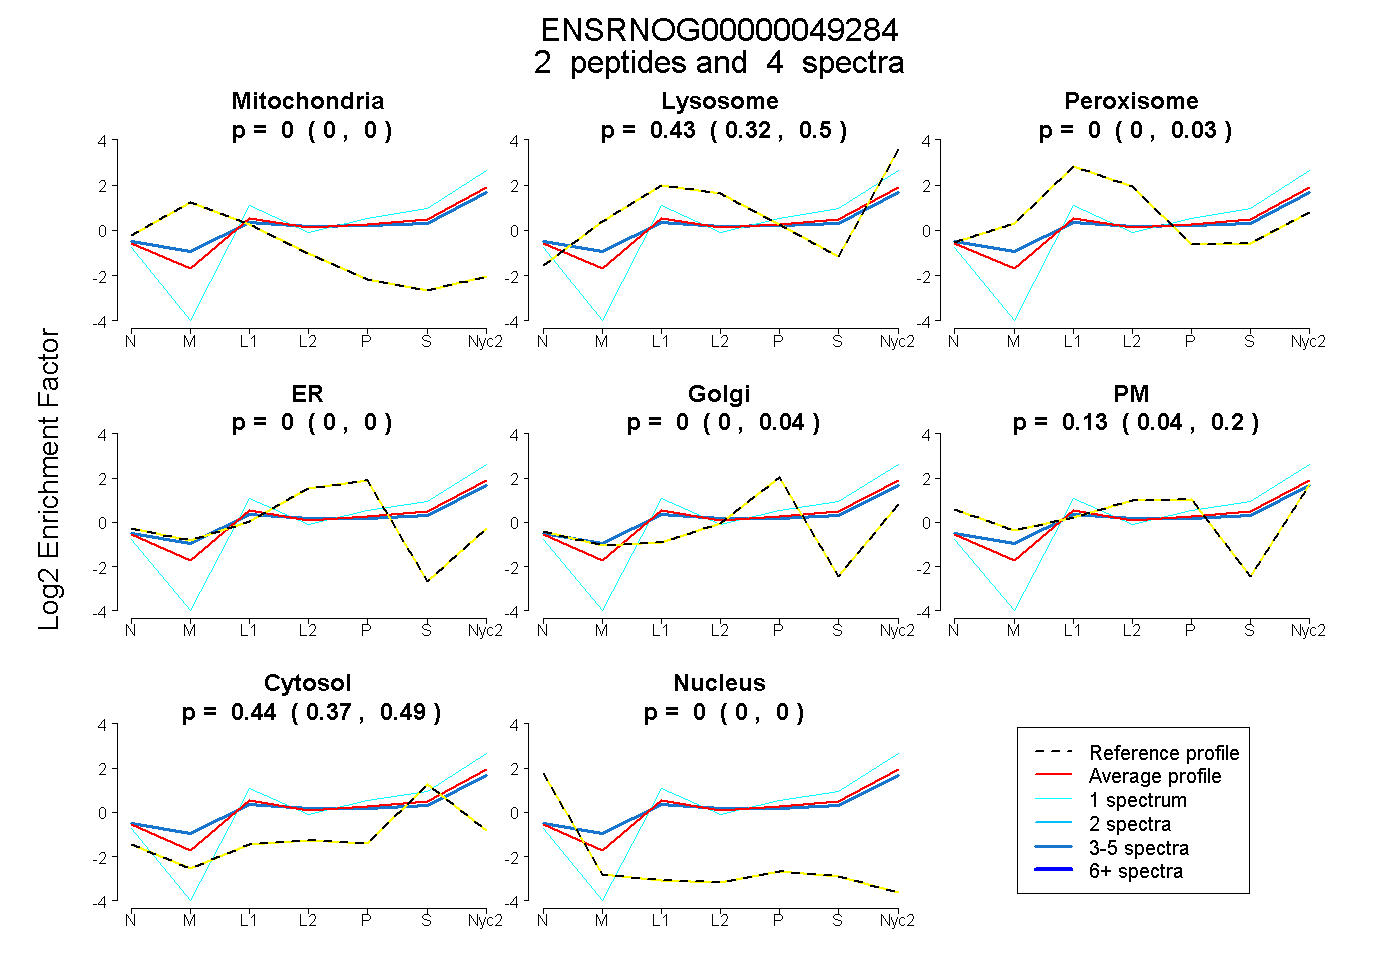
| Expt A |
2 peptides |
4 spectra |
|
0.000 0.000 | 0.000 |
0.426 0.318 | 0.505 |
0.000 0.000 | 0.033 |
0.000 0.000 | 0.000 |
0.000 0.000 | 0.043 |
0.134 0.040 | 0.198 |
0.439 0.366 | 0.491 |
0.000 0.000 | 0.000 |
||
| Plot | Lyso | Other | |||||||||||
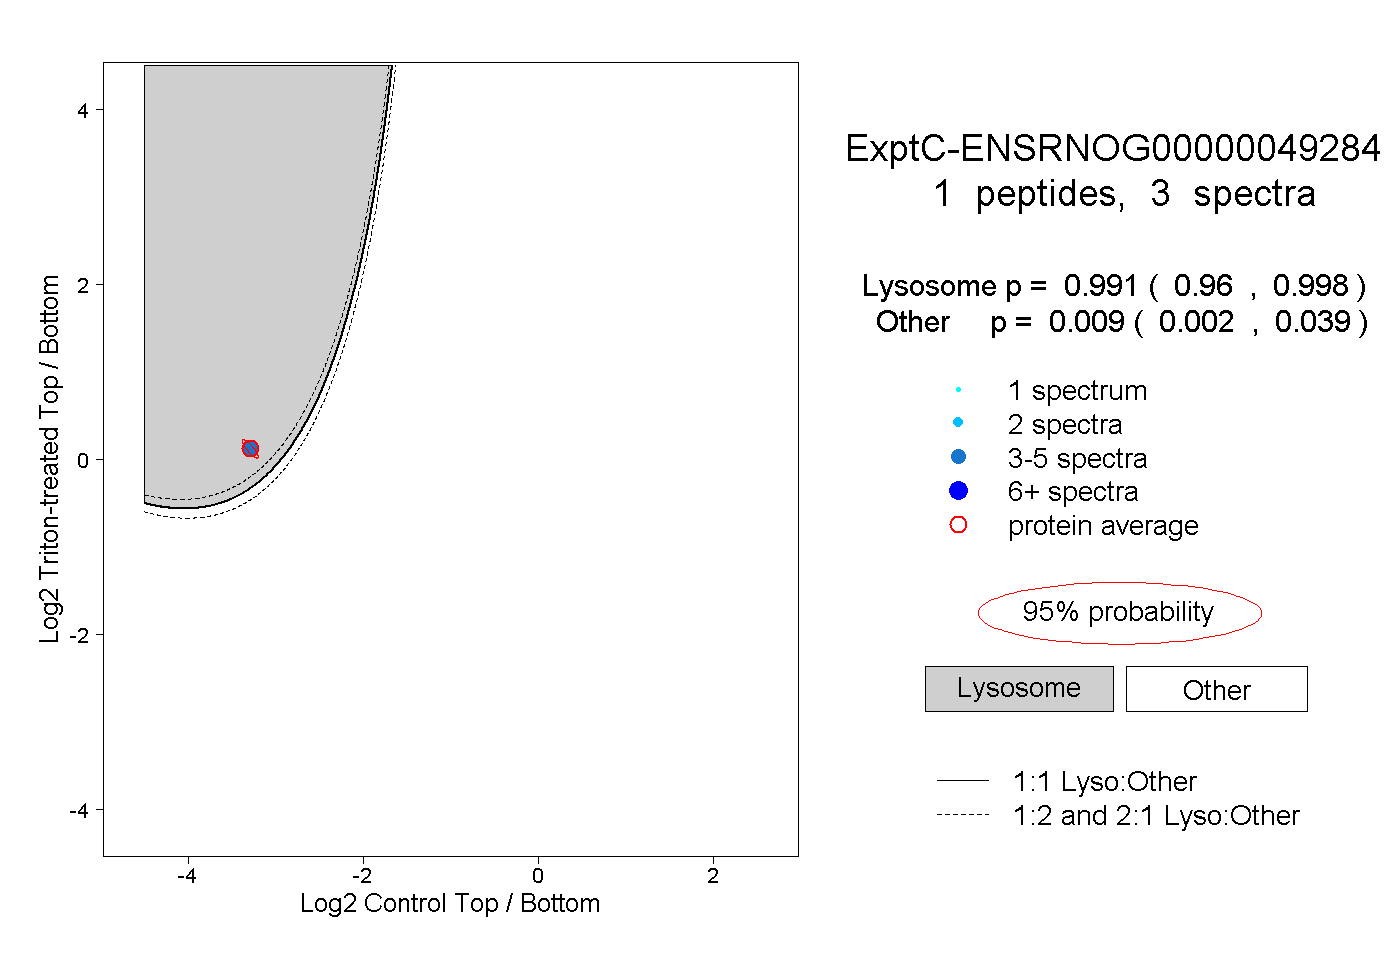
| Expt C |
1 peptide |
3 spectra |
|
0.991 0.960 | 0.998 |
0.009 0.002 | 0.039 |
| 3 spectra, FSGSGSGTQYSLK | 0.991 | 0.009 |
| Plot | Lyso | Other | |||||||||||
| Expt D |
1 peptide |
1 spectrum |
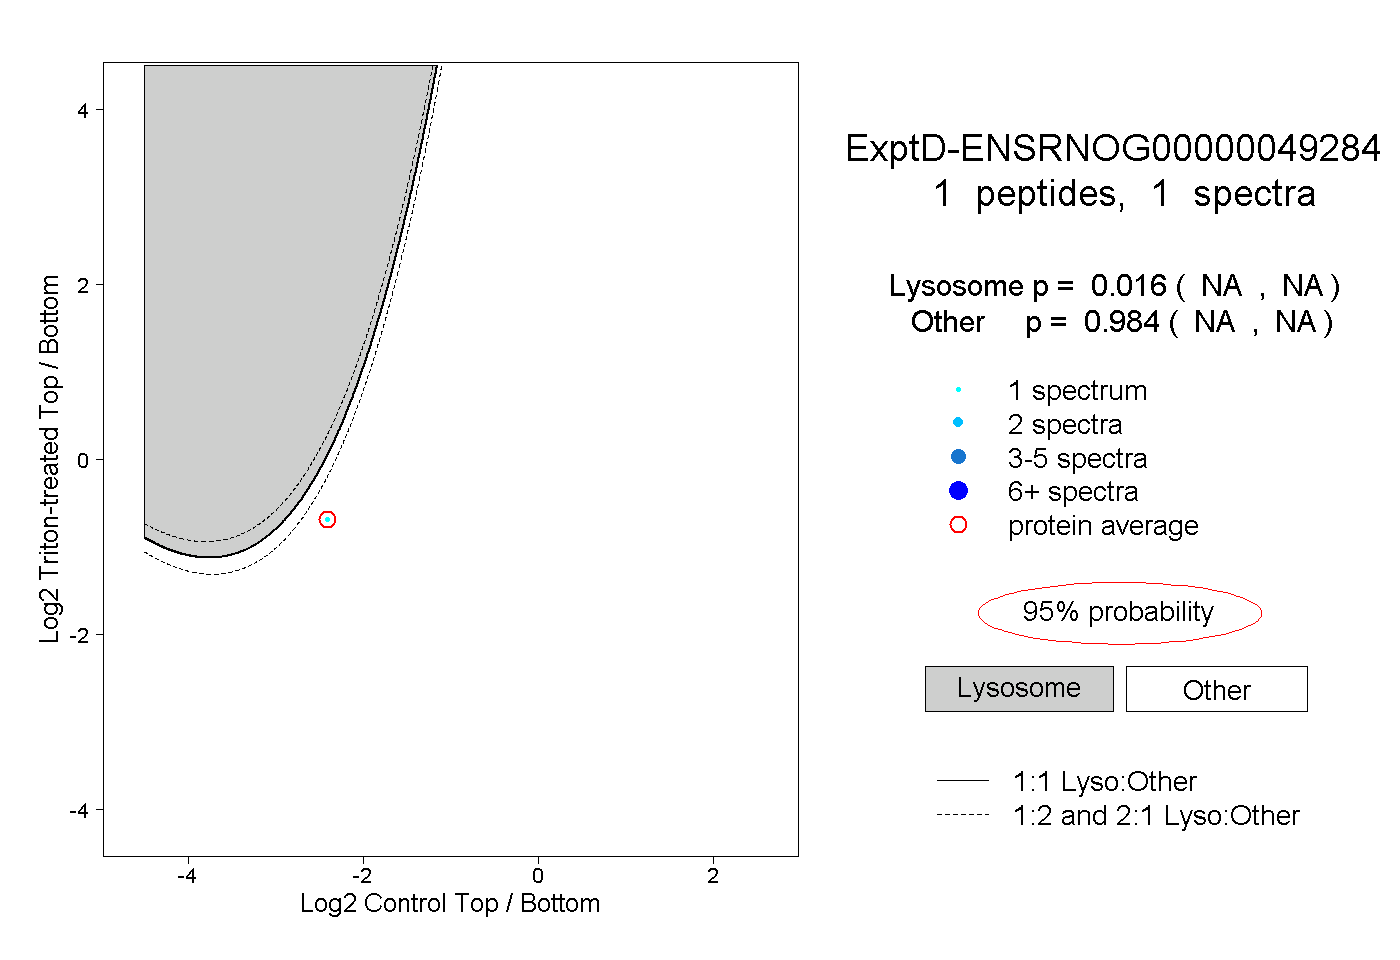 |
0.016 NA | NA |
0.984 NA | NA |