 12
12peptides
spectra
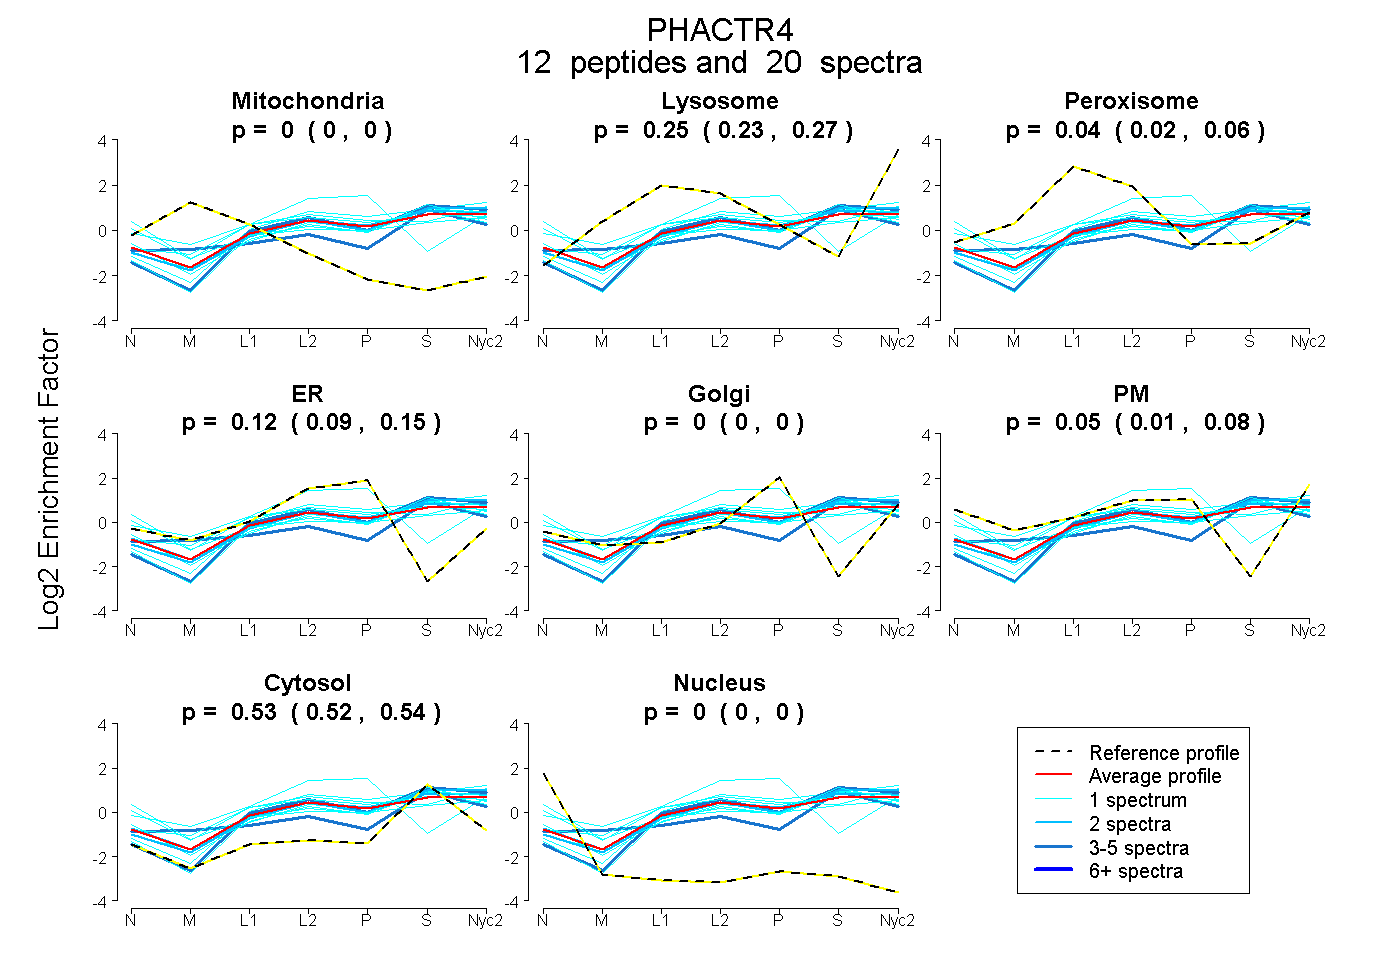
0.000 | 0.000
0.229 | 0.275
0.019 | 0.057
0.094 | 0.149
0.000 | 0.000
0.011 | 0.083
0.521 | 0.542
0.000 | 0.000
9peptides
spectra
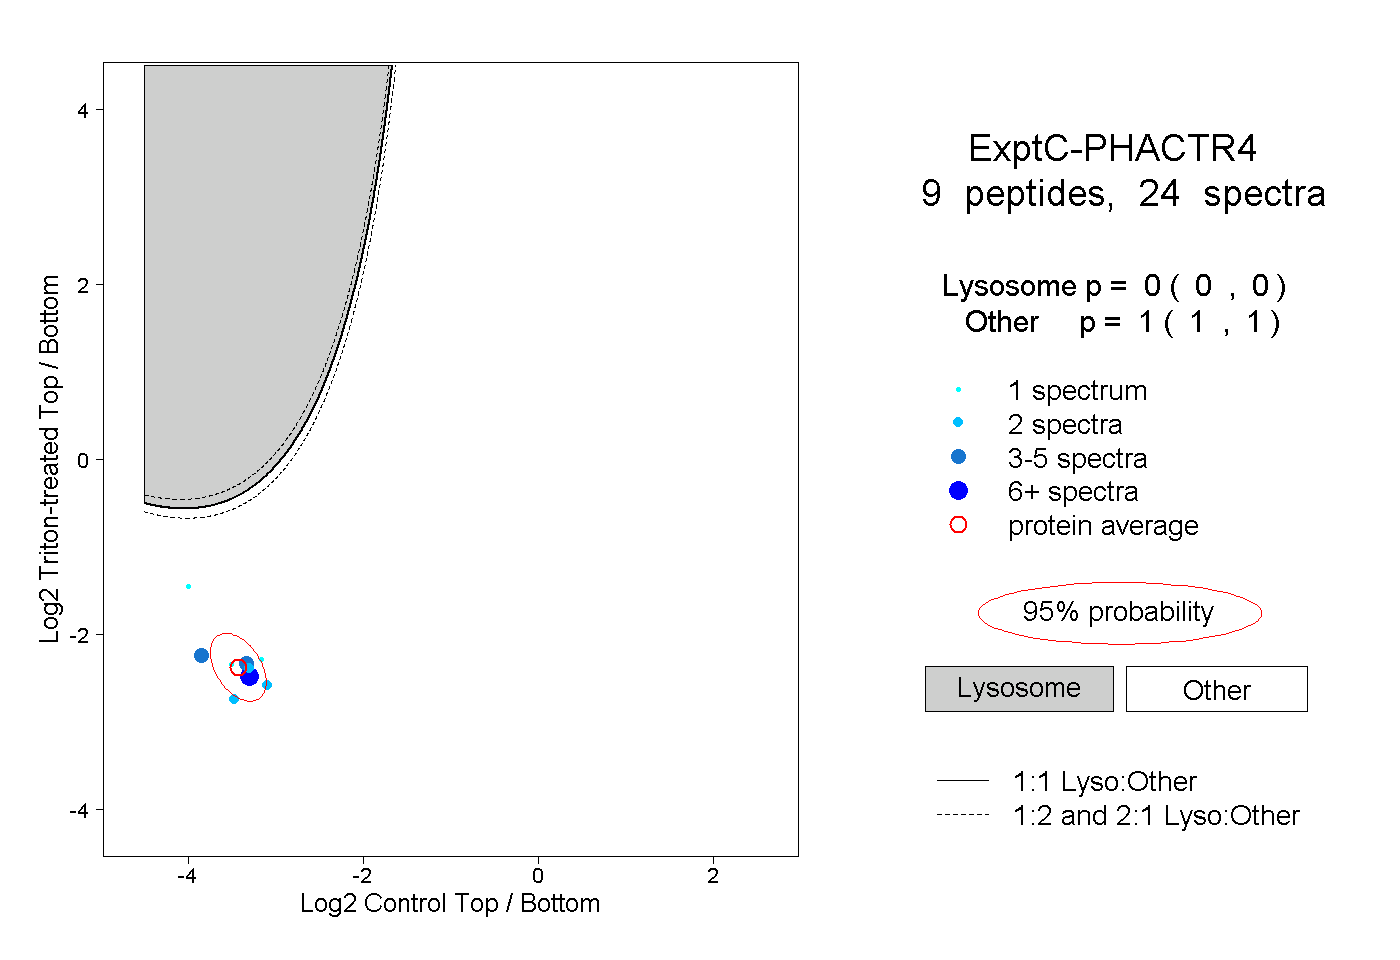
0.000 | 0.000
1.000 | 1.000
3peptides
spectra
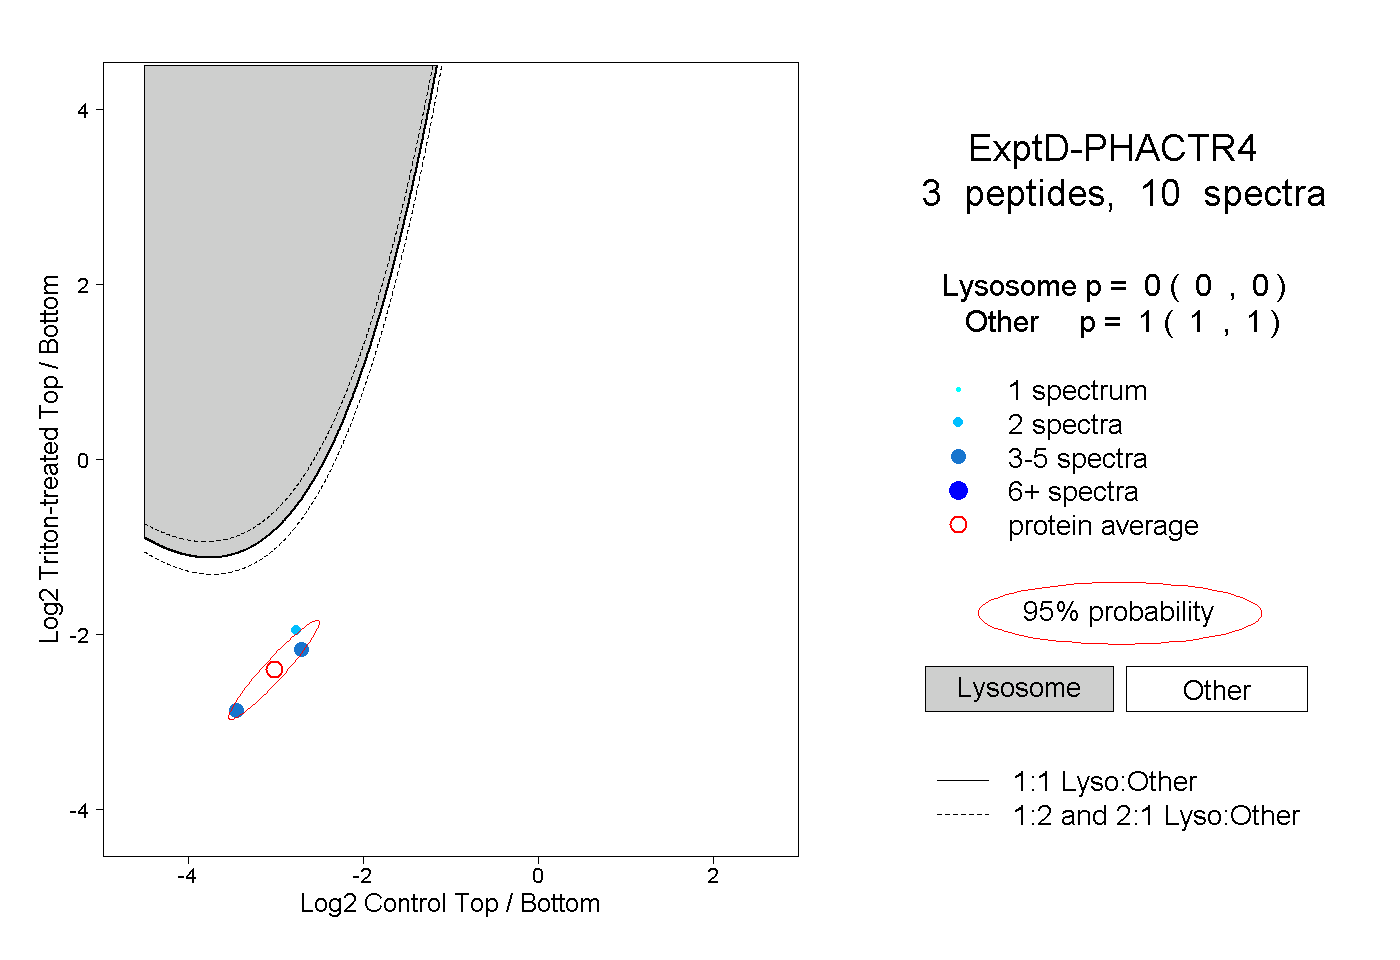
0.000 | 0.000
1.000 | 1.000