 3
3peptides
spectra
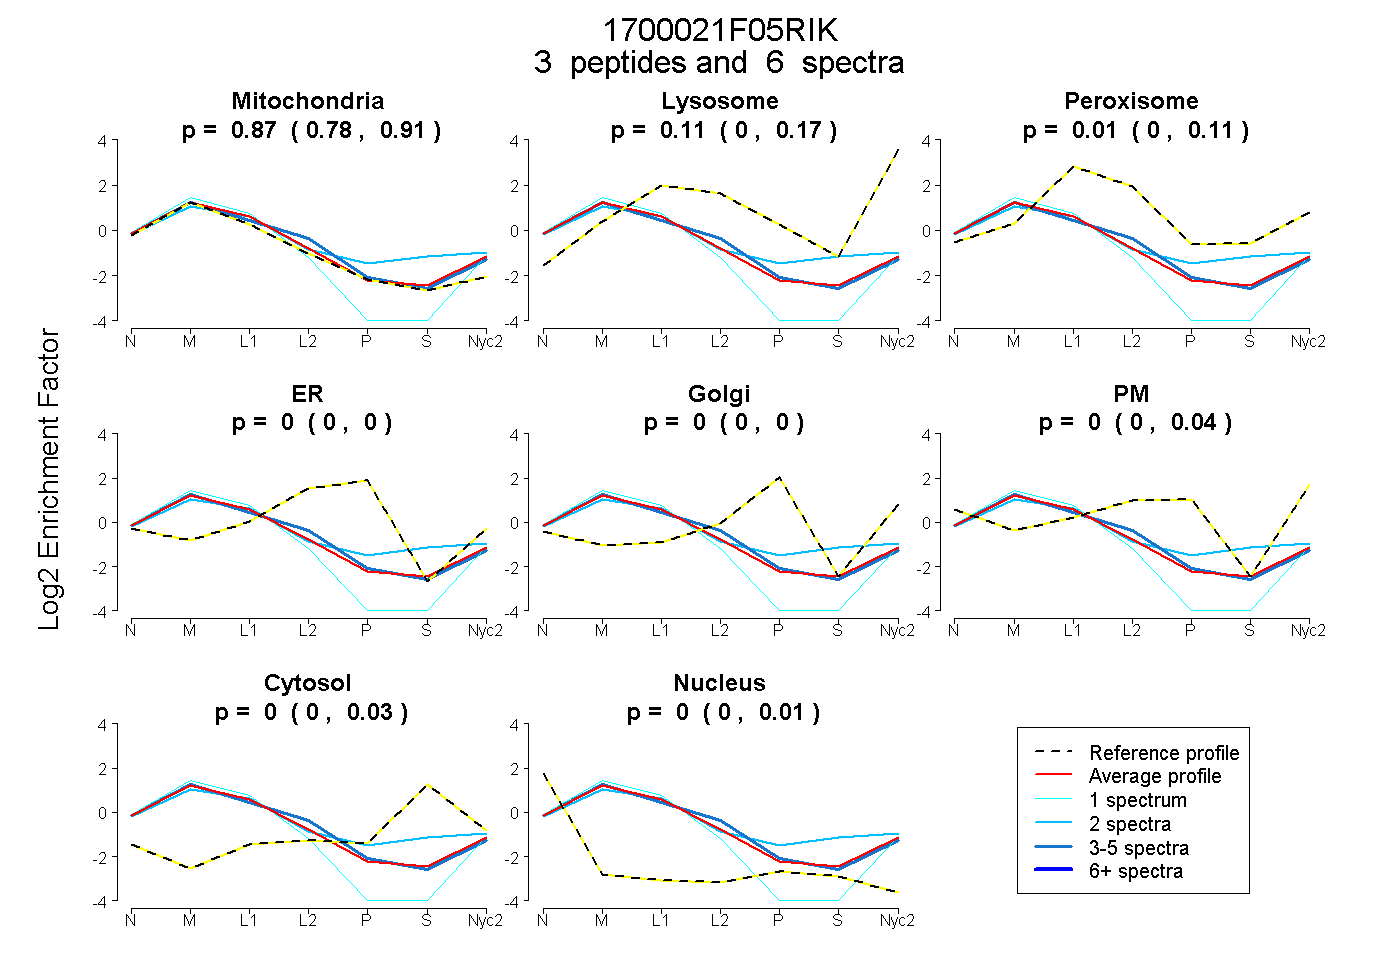
0.782 | 0.912
0.000 | 0.169
0.000 | 0.115
0.000 | 0.000
0.000 | 0.000
0.000 | 0.045
0.000 | 0.031
0.000 | 0.007
2peptides
spectra
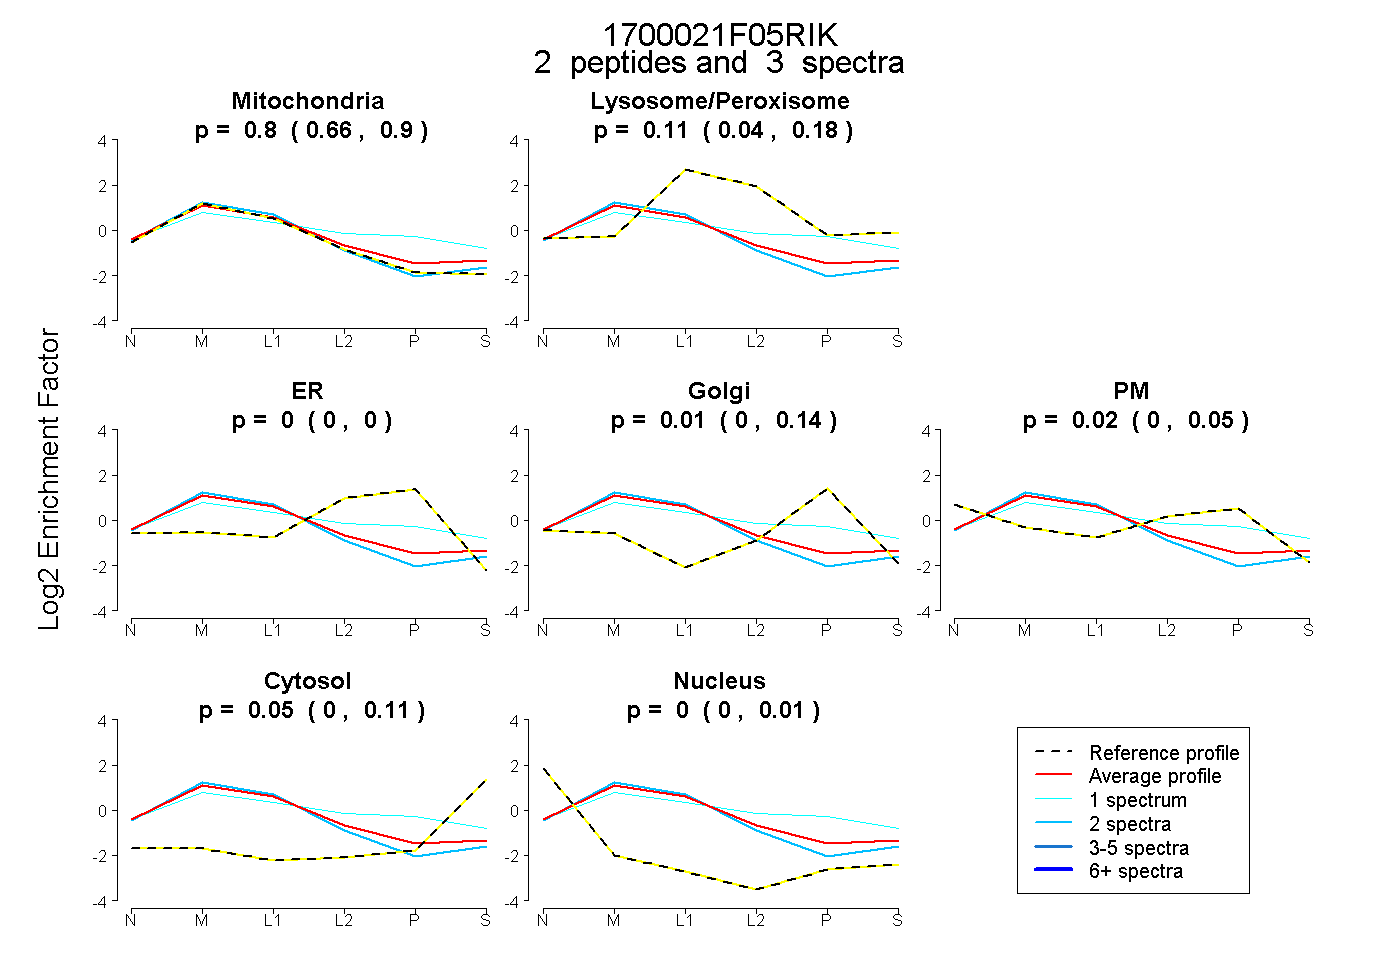
0.660 | 0.902
0.035 | 0.183
0.000 | 0.000
0.000 | 0.136
0.000 | 0.050
0.000 | 0.106
0.000 | 0.007
5peptides
spectra
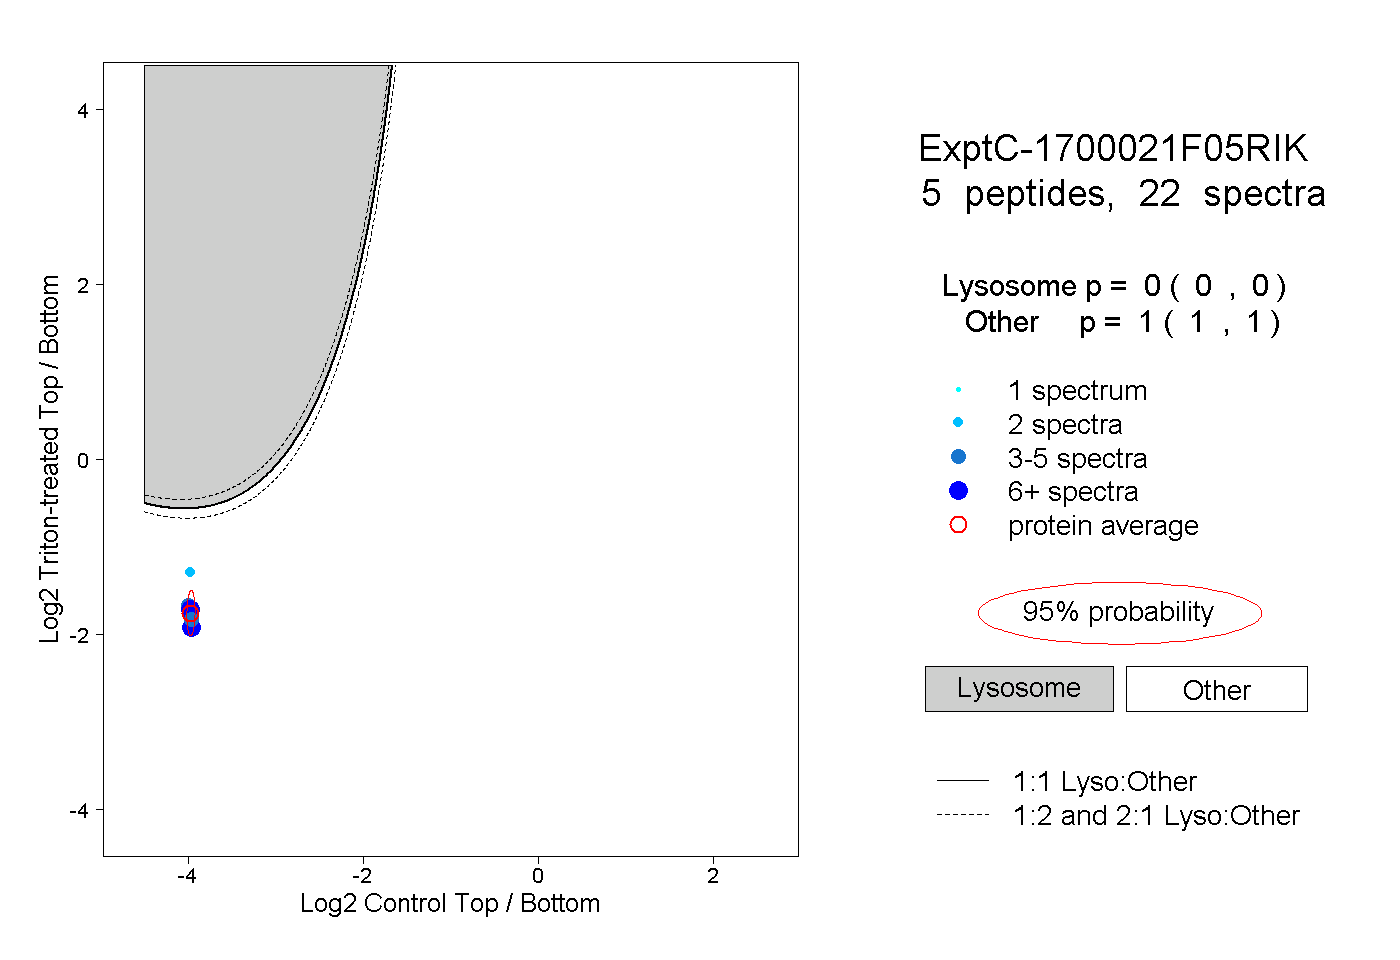
0.000 | 0.000
1.000 | 1.000
3peptides
spectra
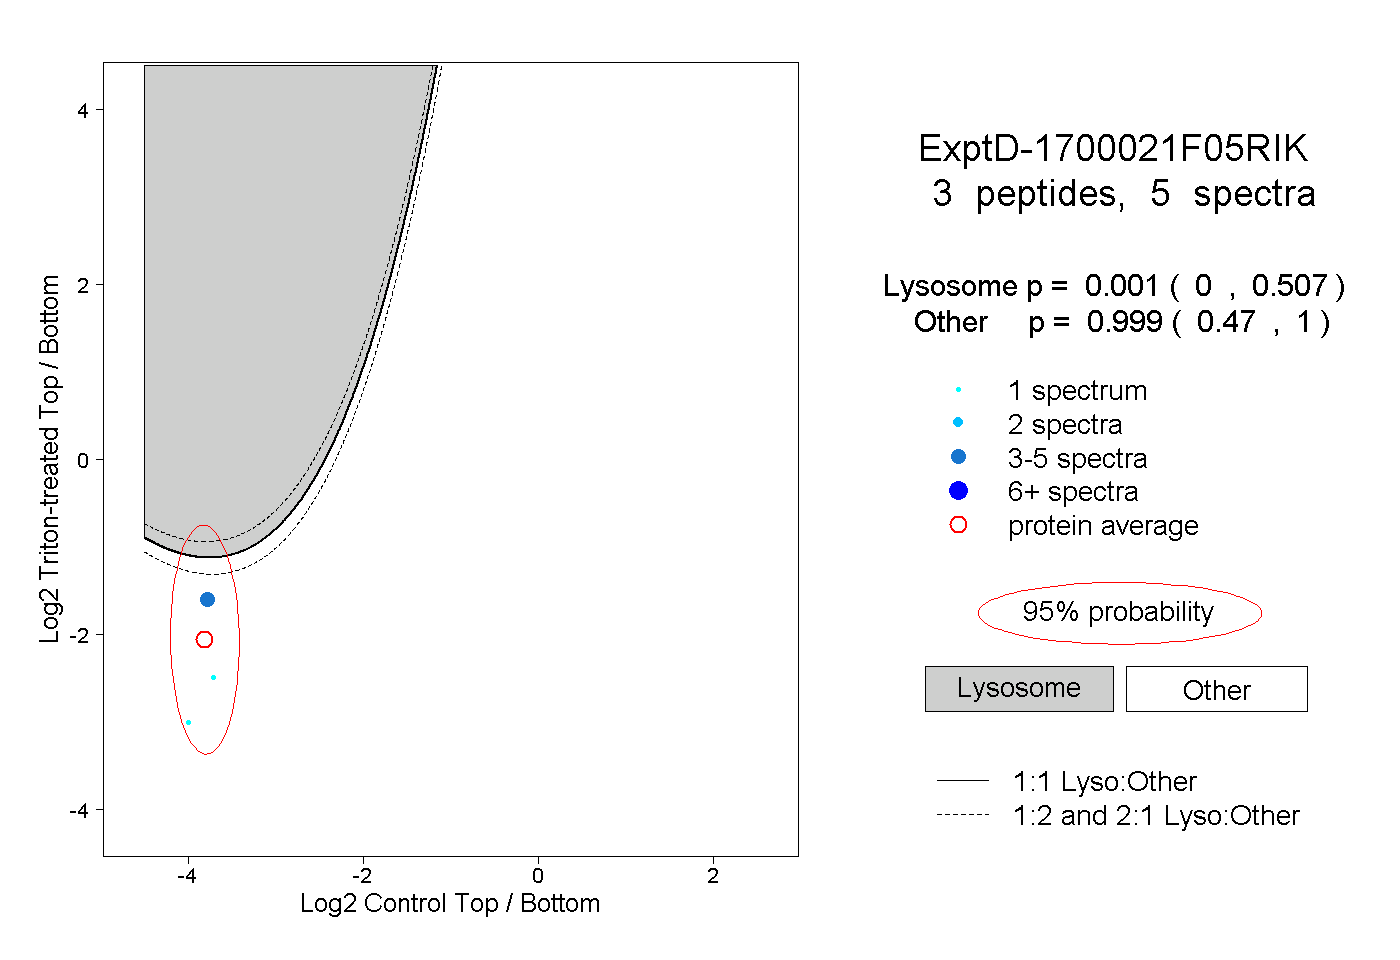
0.000 | 0.507
0.470 | 1.000