 2
2peptides
spectra
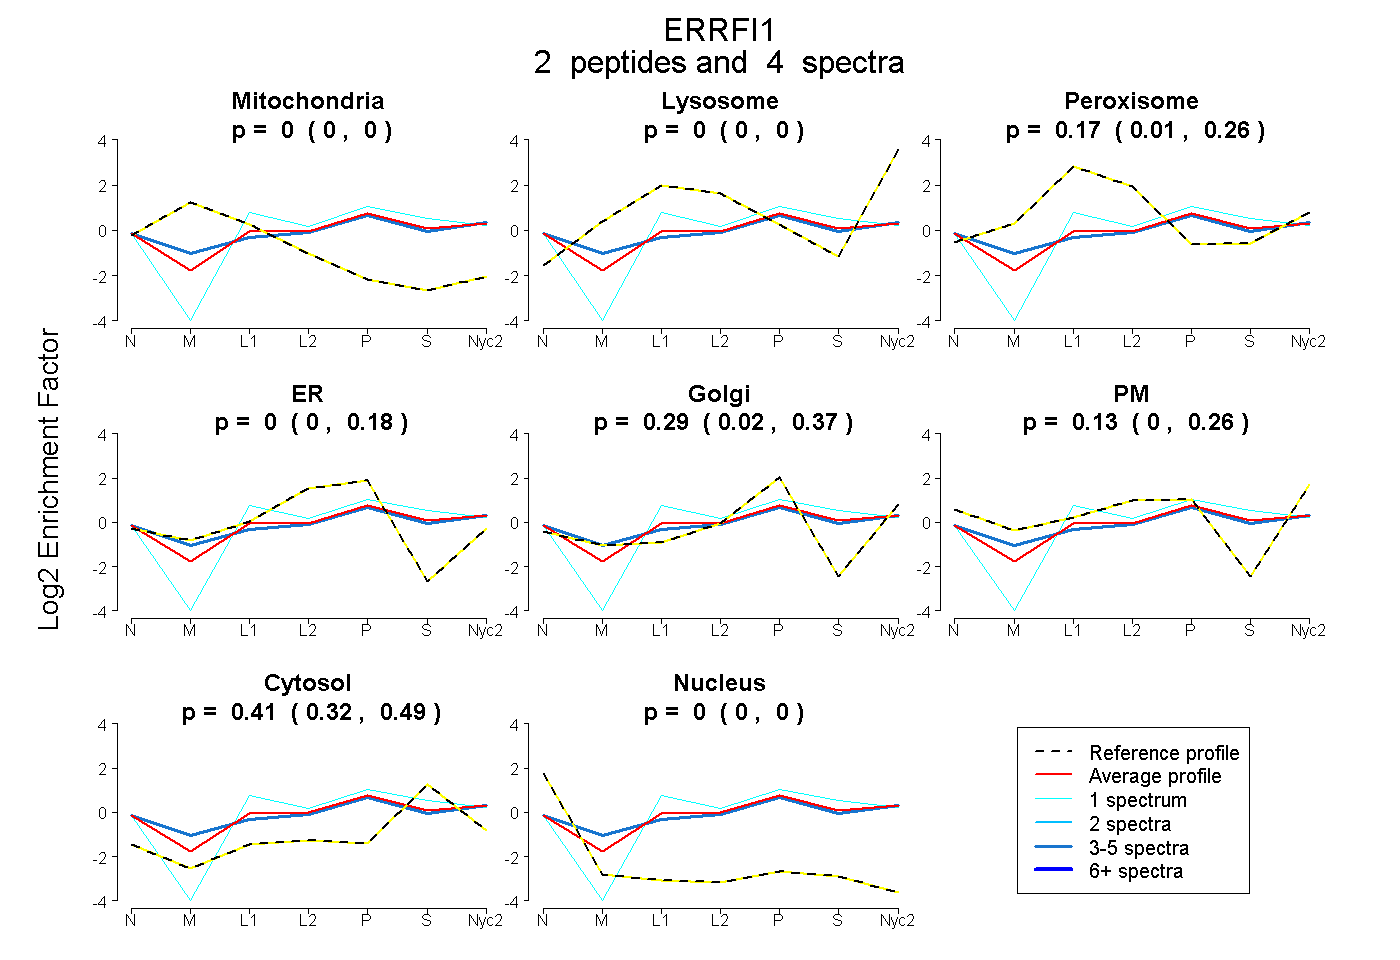
0.000 | 0.000
0.000 | 0.000
0.006 | 0.255
0.000 | 0.181
0.017 | 0.365
0.002 | 0.259
0.321 | 0.494
0.000 | 0.000
| Plot | Mito | Lyso | Perox | ER | Golgi | PM | Cytosol | Nucleus | |||||
| Expt A |
2 peptides |
4 spectra |
|
0.000 0.000 | 0.000 |
0.000 0.000 | 0.000 |
0.172 0.006 | 0.255 |
0.005 0.000 | 0.181 |
0.291 0.017 | 0.365 |
0.127 0.002 | 0.259 |
0.406 0.321 | 0.494 |
0.000 0.000 | 0.000 |
| 1 spectrum, MDVGGHGK | 0.000 | 0.009 | 0.116 | 0.279 | 0.056 | 0.010 | 0.531 | 0.000 | ||
| 3 spectra, VVPDPNPPPPQSHR | 0.000 | 0.000 | 0.151 | 0.000 | 0.266 | 0.202 | 0.381 | 0.000 |
| Plot | Lyso | Other | |||||||||||
| Expt C |
3 peptides |
4 spectra |
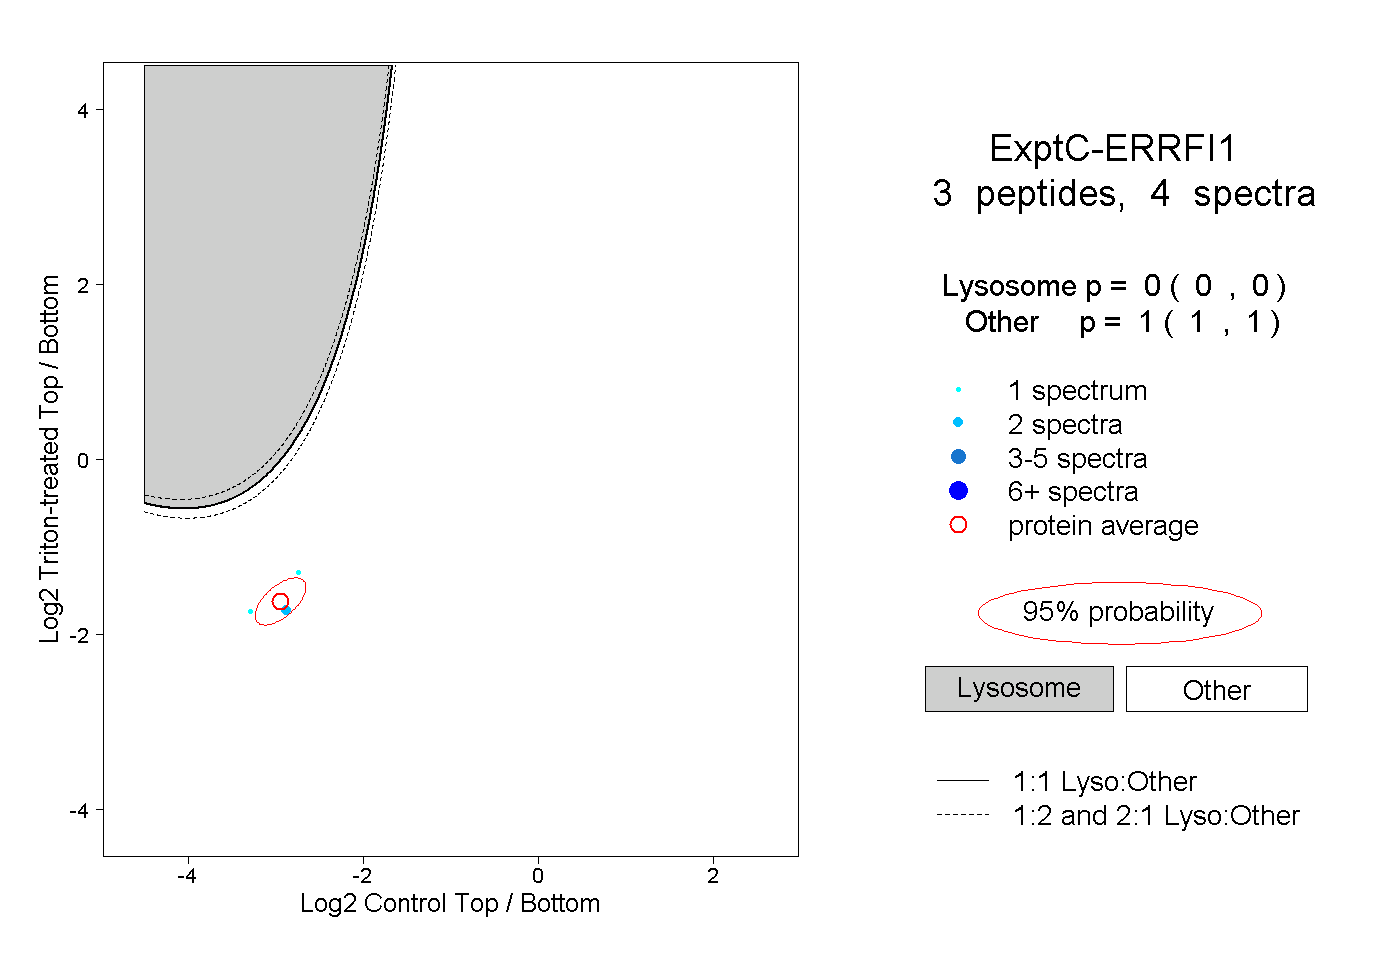 |
0.000 0.000 | 0.000 |
1.000 1.000 | 1.000 |