 5
5peptides
spectra
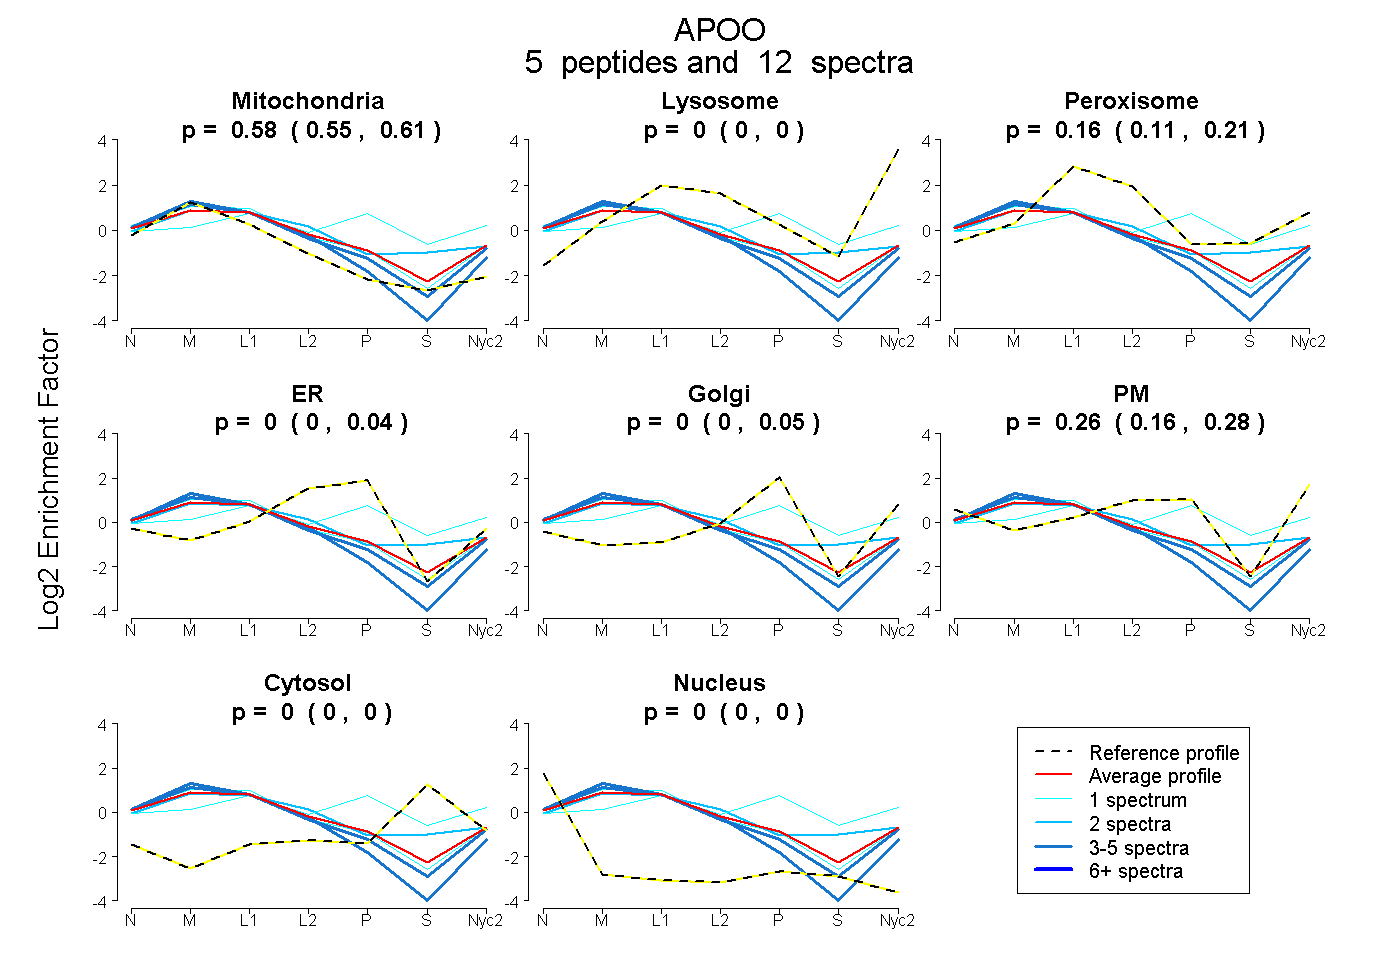
0.546 | 0.608
0.000 | 0.001
0.111 | 0.209
0.000 | 0.045
0.000 | 0.055
0.162 | 0.285
0.000 | 0.000
0.000 | 0.000
| Plot | Mito | Lyso | Perox | ER | Golgi | PM | Cytosol | Nucleus | |||||
| Expt A |
5 peptides |
12 spectra |
|
0.583 0.546 | 0.608 |
0.000 0.000 | 0.001 |
0.158 0.111 | 0.209 |
0.000 0.000 | 0.045 |
0.000 0.000 | 0.055 |
0.259 0.162 | 0.285 |
0.000 0.000 | 0.000 |
0.000 0.000 | 0.000 |
| 1 spectrum, LYDWGLR | 0.099 | 0.000 | 0.388 | 0.000 | 0.394 | 0.000 | 0.119 | 0.000 | ||
| 4 spectra, TQLEENISELR | 0.816 | 0.000 | 0.000 | 0.000 | 0.000 | 0.184 | 0.000 | 0.000 | ||
| 2 spectra, IDELSLYSVPEGQSK | 0.459 | 0.000 | 0.355 | 0.000 | 0.000 | 0.076 | 0.110 | 0.000 | ||
| 4 spectra, YVEEPR | 0.692 | 0.029 | 0.045 | 0.000 | 0.000 | 0.234 | 0.000 | 0.000 | ||
| 1 spectrum, GYIVVEDLWK | 0.610 | 0.000 | 0.126 | 0.000 | 0.000 | 0.264 | 0.000 | 0.000 |
| Plot | Mito | Lyso or Perox | ER | Golgi | PM | Cytosol | Nucleus | ||||||
| Expt B |
4 peptides |
5 spectra |
 |
1.000 1.000 | 1.000 |
0.000 0.000 | 0.000 |
0.000 0.000 | 0.000 |
0.000 0.000 | 0.000 |
0.000 0.000 | 0.000 |
0.000 0.000 | 0.000 |
0.000 0.000 | 0.000 |
|||
| Plot | Lyso | Other | |||||||||||
| Expt C |
6 peptides |
62 spectra |
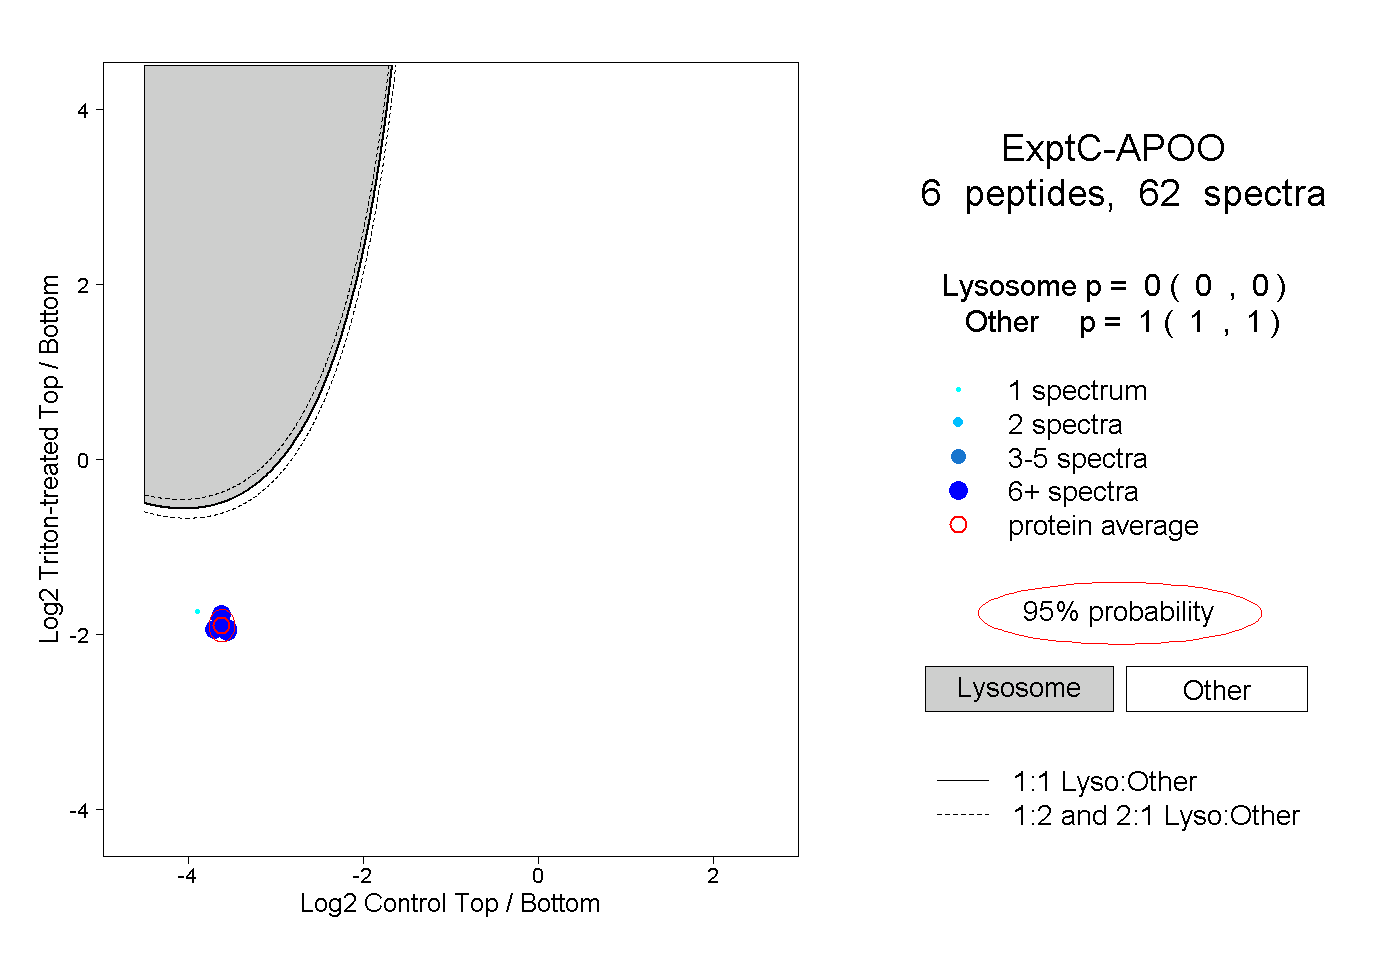 |
0.000 0.000 | 0.000 |
1.000 1.000 | 1.000 |
||||||||
| Plot | Lyso | Other | |||||||||||
| Expt D |
3 peptides |
10 spectra |
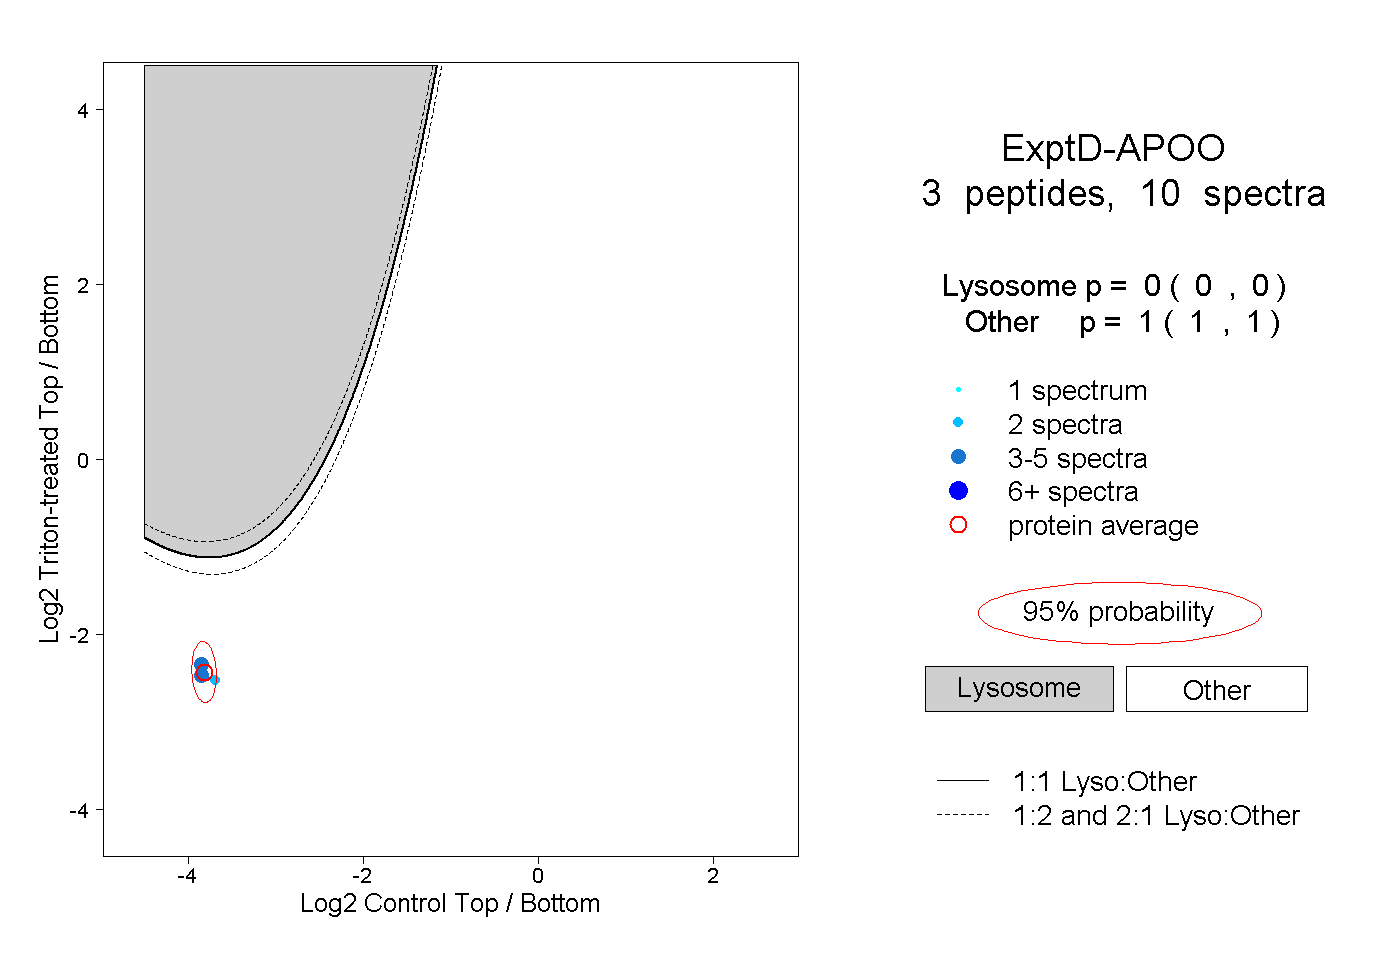 |
0.000 0.000 | 0.000 |
1.000 1.000 | 1.000 |