 7
7peptides
spectra
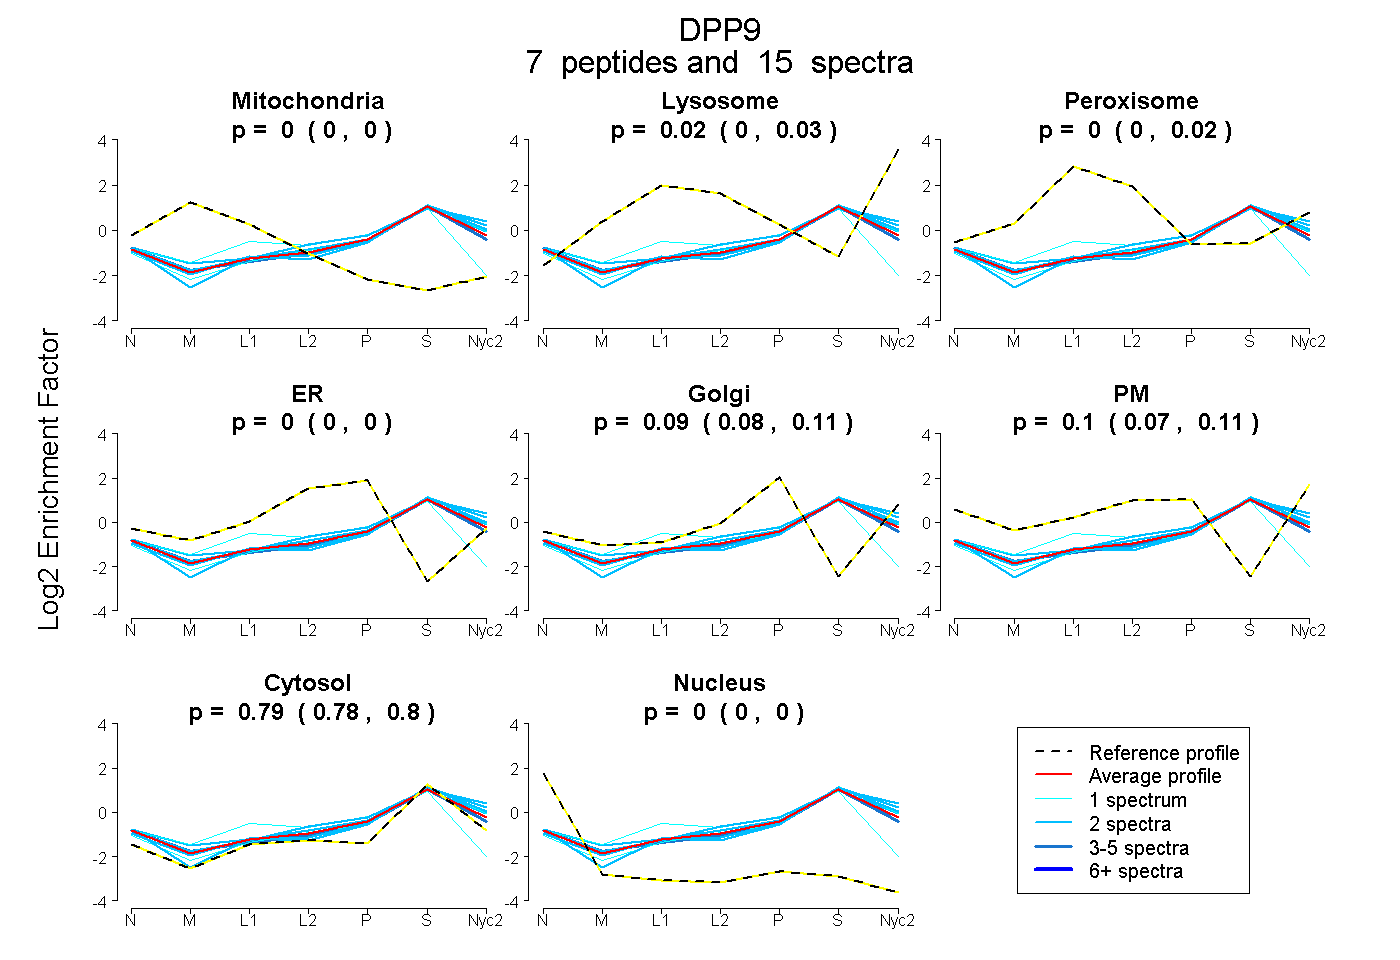
0.000 | 0.000
0.000 | 0.034
0.000 | 0.017
0.000 | 0.000
0.076 | 0.112
0.073 | 0.115
0.779 | 0.796
0.000 | 0.000
2peptides
spectra
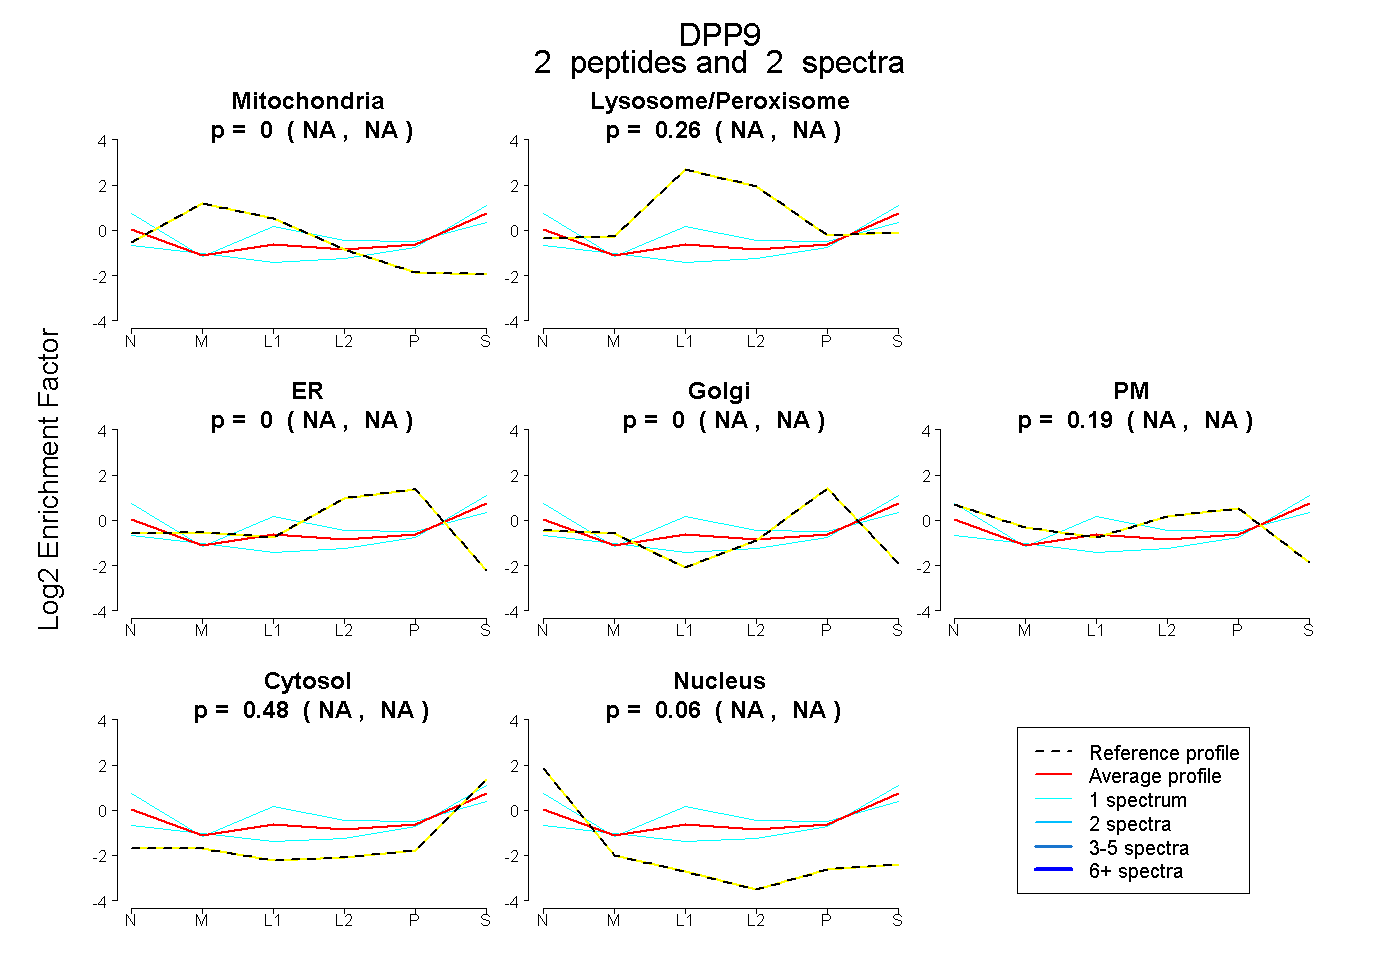
NA | NA
NA | NA
NA | NA
NA | NA
NA | NA
NA | NA
NA | NA
12peptides
spectra
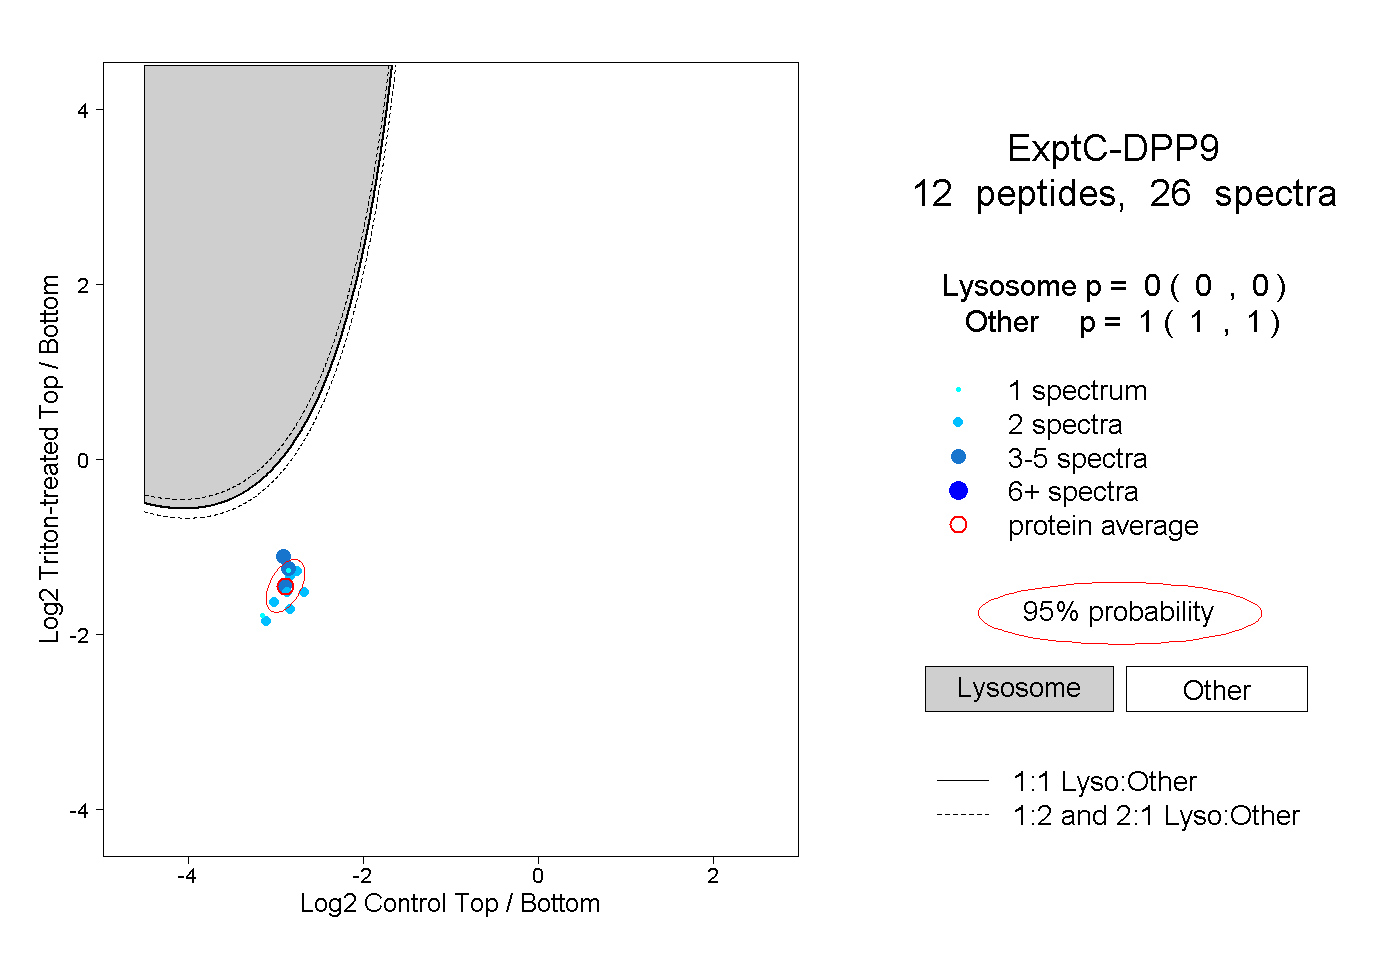
0.000 | 0.000
1.000 | 1.000
1peptide
spectrum
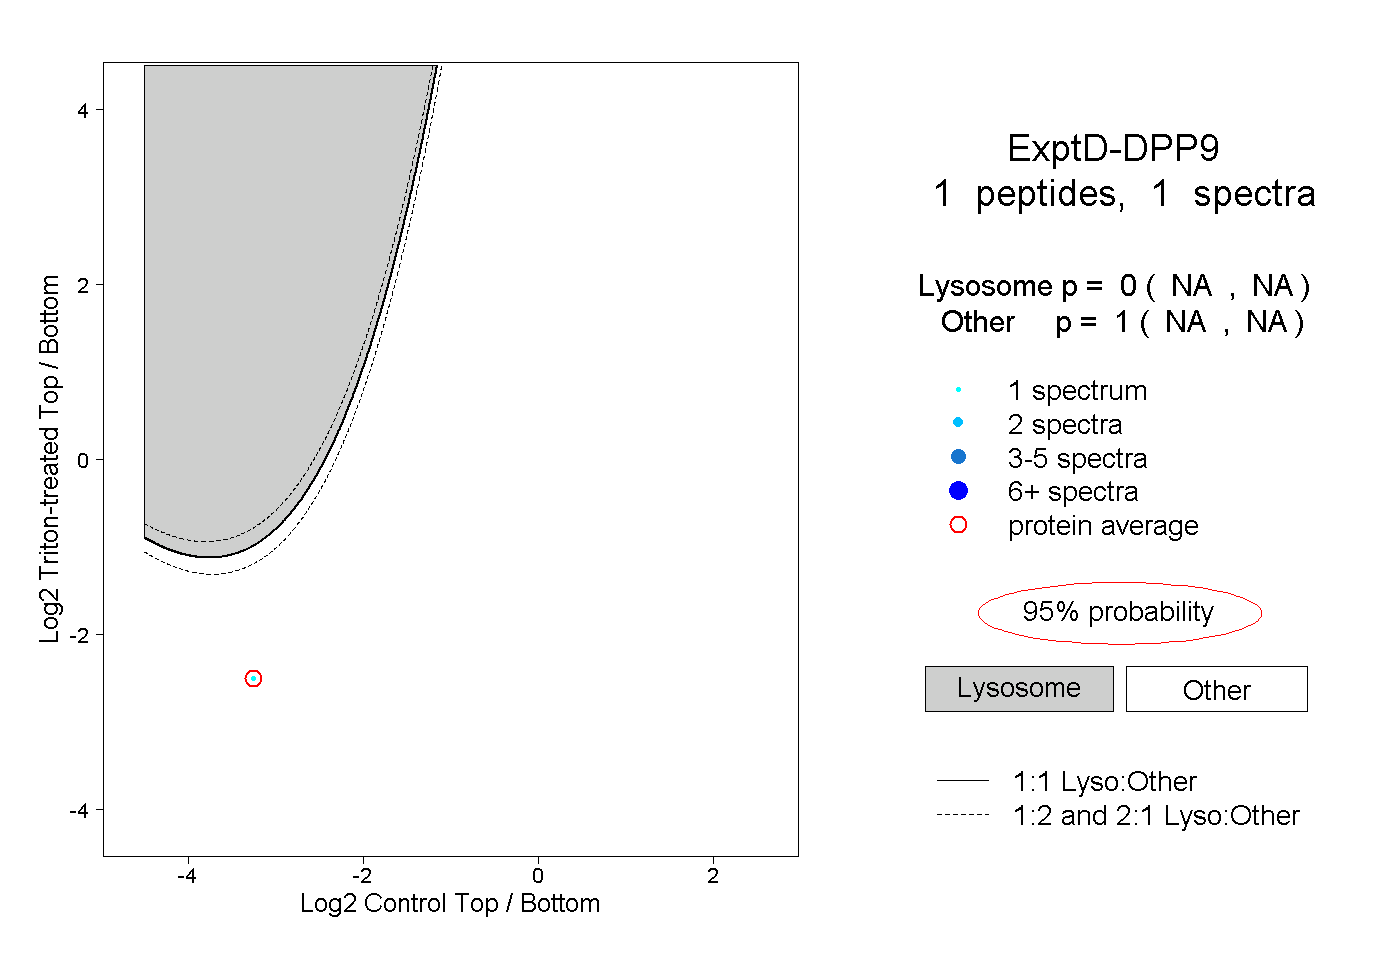
NA | NA
NA | NA