 1
1peptide
spectrum
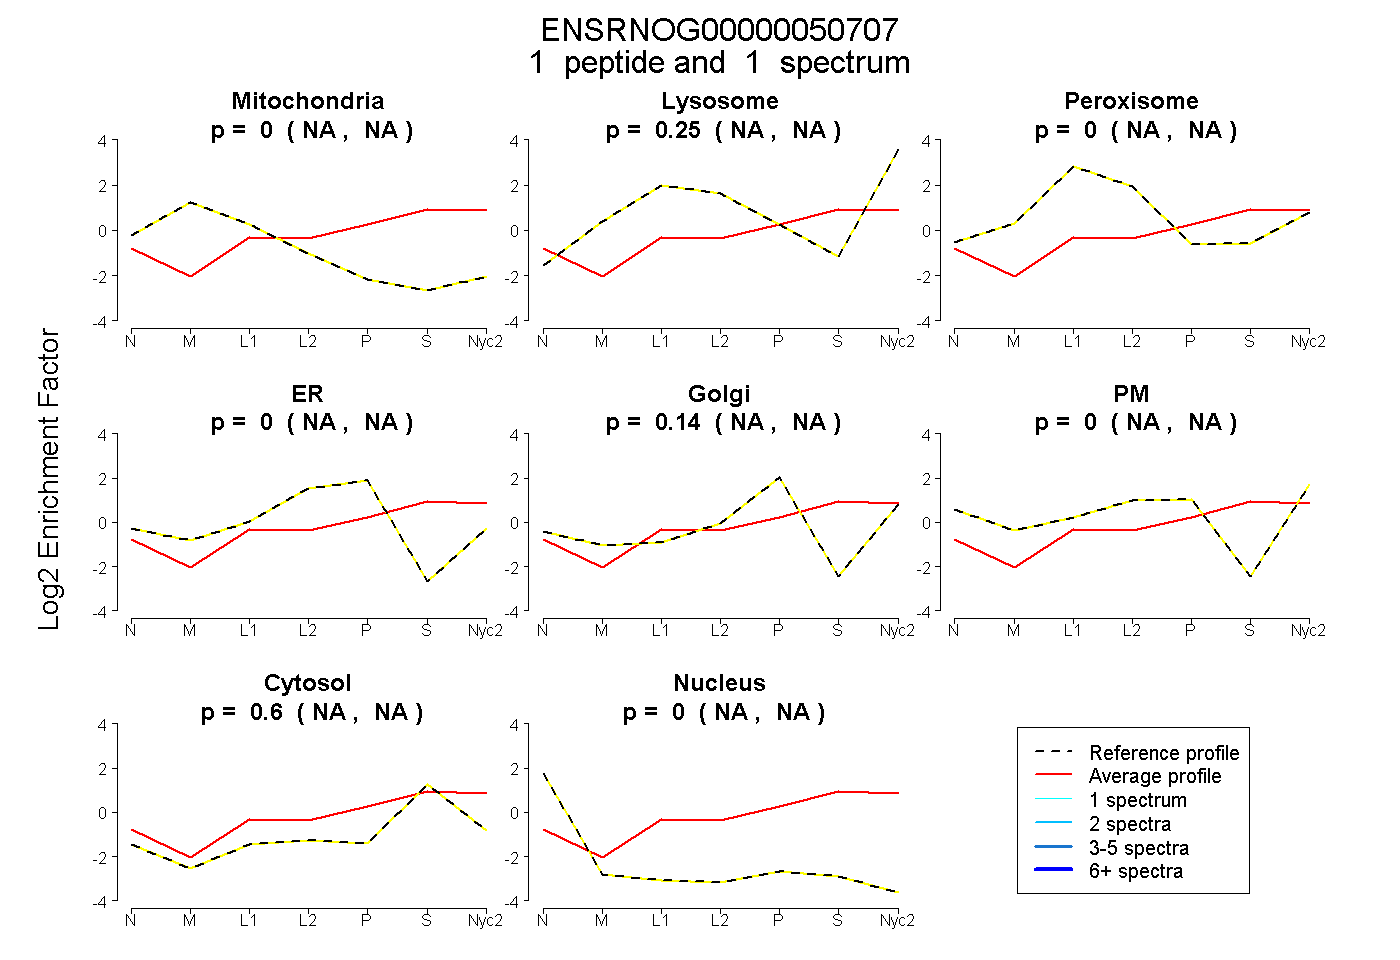
NA | NA
NA | NA
NA | NA
NA | NA
NA | NA
NA | NA
NA | NA
NA | NA
3peptides
spectra
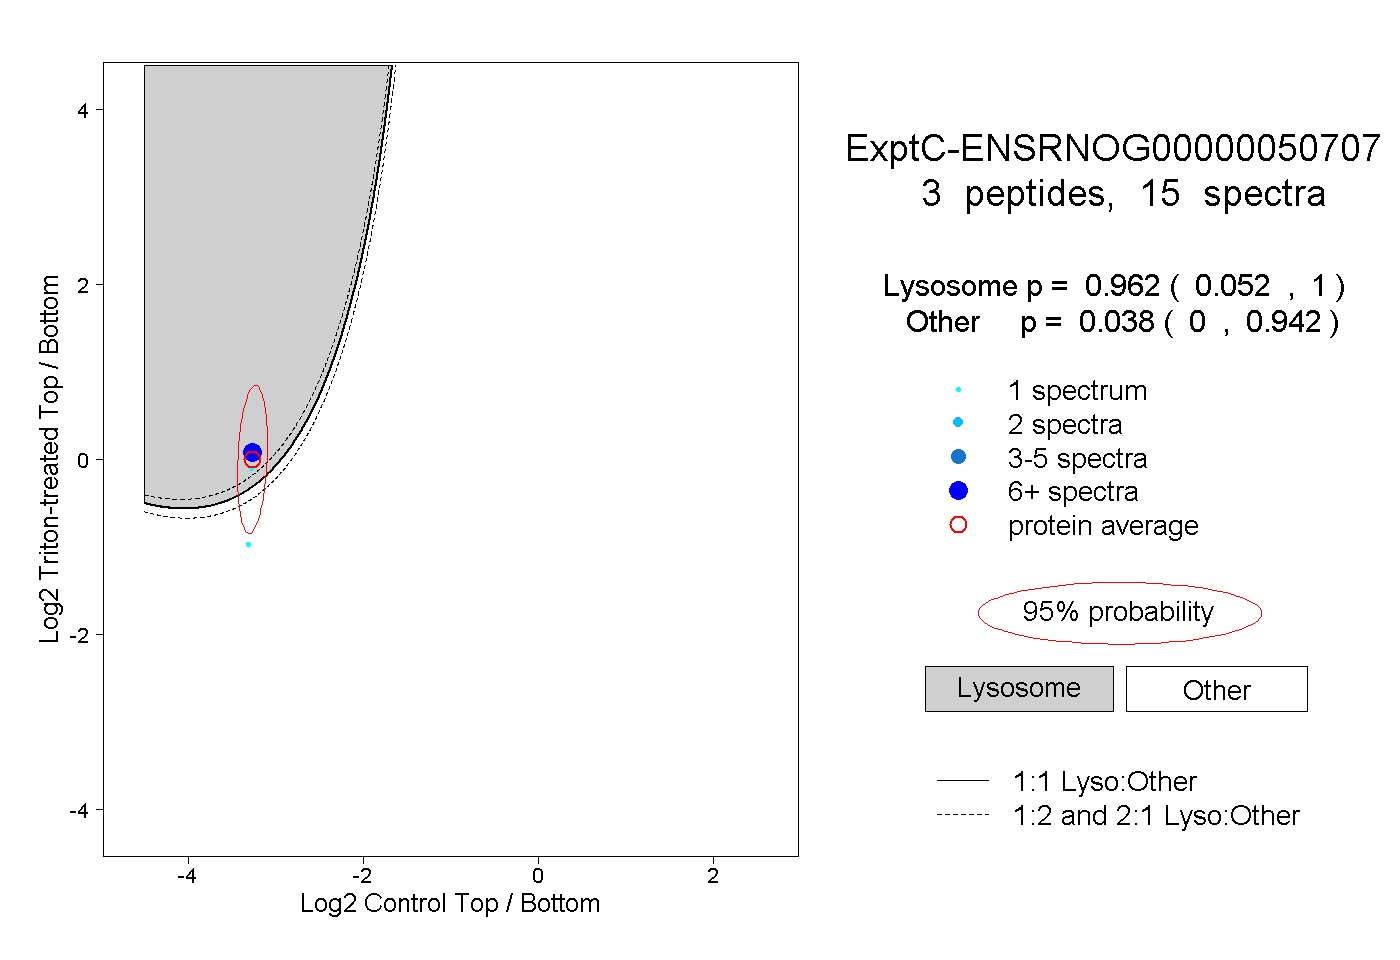
0.052 | 1.000
0.000 | 0.942
| Plot | Mito | Lyso | Perox | ER | Golgi | PM | Cytosol | Nucleus | |||||
| Expt A |
1 peptide |
1 spectrum |
|
0.000 NA | NA |
0.254 NA | NA |
0.000 NA | NA |
0.000 NA | NA |
0.144 NA | NA |
0.000 NA | NA |
0.602 NA | NA |
0.000 NA | NA |
||
| Plot | Lyso | Other | |||||||||||
| Expt C |
3 peptides |
15 spectra |
|
0.962 0.052 | 1.000 |
0.038 0.000 | 0.942 |