 4
4peptides
spectra
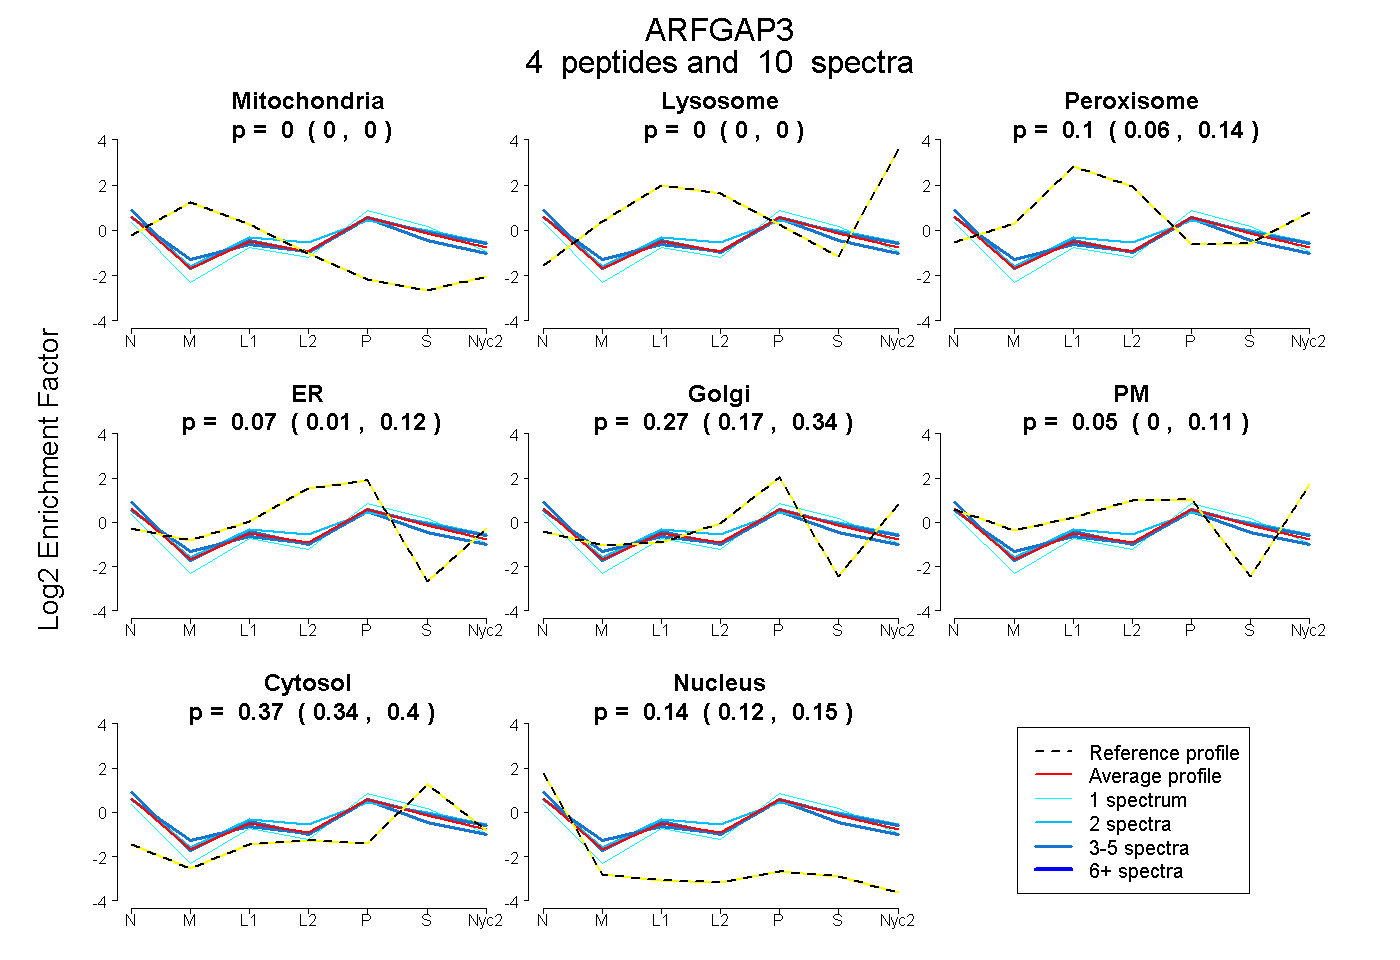
0.000 | 0.000
0.000 | 0.000
0.059 | 0.135
0.009 | 0.123
0.174 | 0.339
0.000 | 0.108
0.340 | 0.399
0.120 | 0.149
| Plot | Mito | Lyso | Perox | ER | Golgi | PM | Cytosol | Nucleus | |||||
| Expt A |
4 peptides |
10 spectra |
|
0.000 0.000 | 0.000 |
0.000 0.000 | 0.000 |
0.104 0.059 | 0.135 |
0.066 0.009 | 0.123 |
0.271 0.174 | 0.339 |
0.052 0.000 | 0.108 |
0.372 0.340 | 0.399 |
0.135 0.120 | 0.149 |
| 1 spectrum, DLEIHK | 0.000 | 0.000 | 0.000 | 0.099 | 0.307 | 0.000 | 0.505 | 0.089 | ||
| 2 spectra, WSEQSSSR | 0.000 | 0.000 | 0.057 | 0.146 | 0.000 | 0.271 | 0.443 | 0.084 | ||
| 3 spectra, YFDDPMELR | 0.000 | 0.000 | 0.110 | 0.000 | 0.314 | 0.092 | 0.363 | 0.122 | ||
| 4 spectra, STGSSDRPSSR | 0.000 | 0.000 | 0.152 | 0.078 | 0.283 | 0.002 | 0.269 | 0.216 |
| Plot | Lyso | Other | |||||||||||
| Expt C |
2 peptides |
6 spectra |
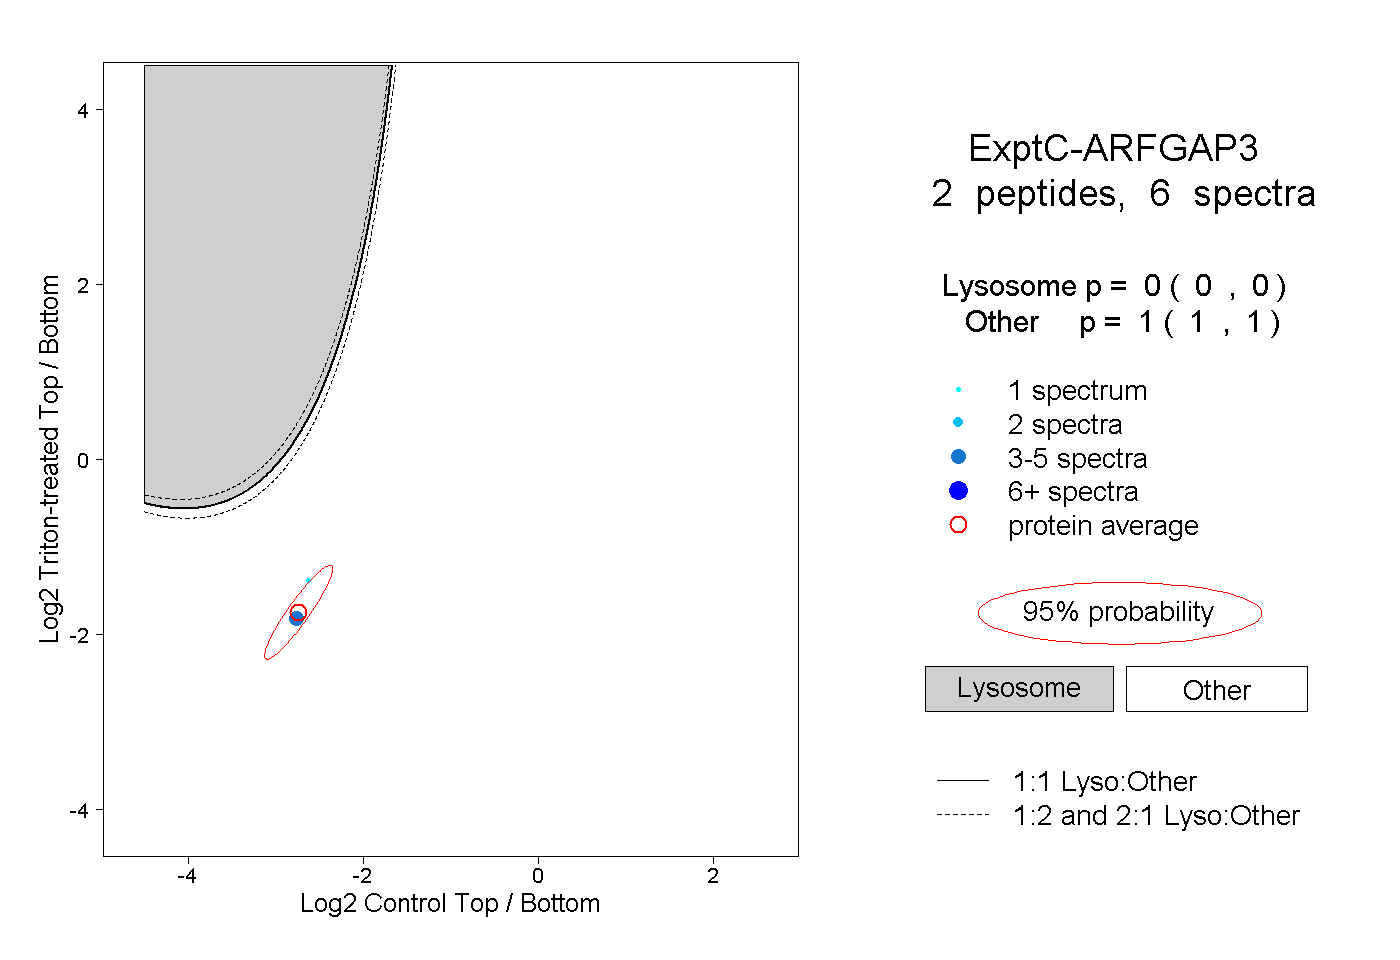 |
0.000 0.000 | 0.000 |
1.000 1.000 | 1.000 |