 10
10peptides
spectra
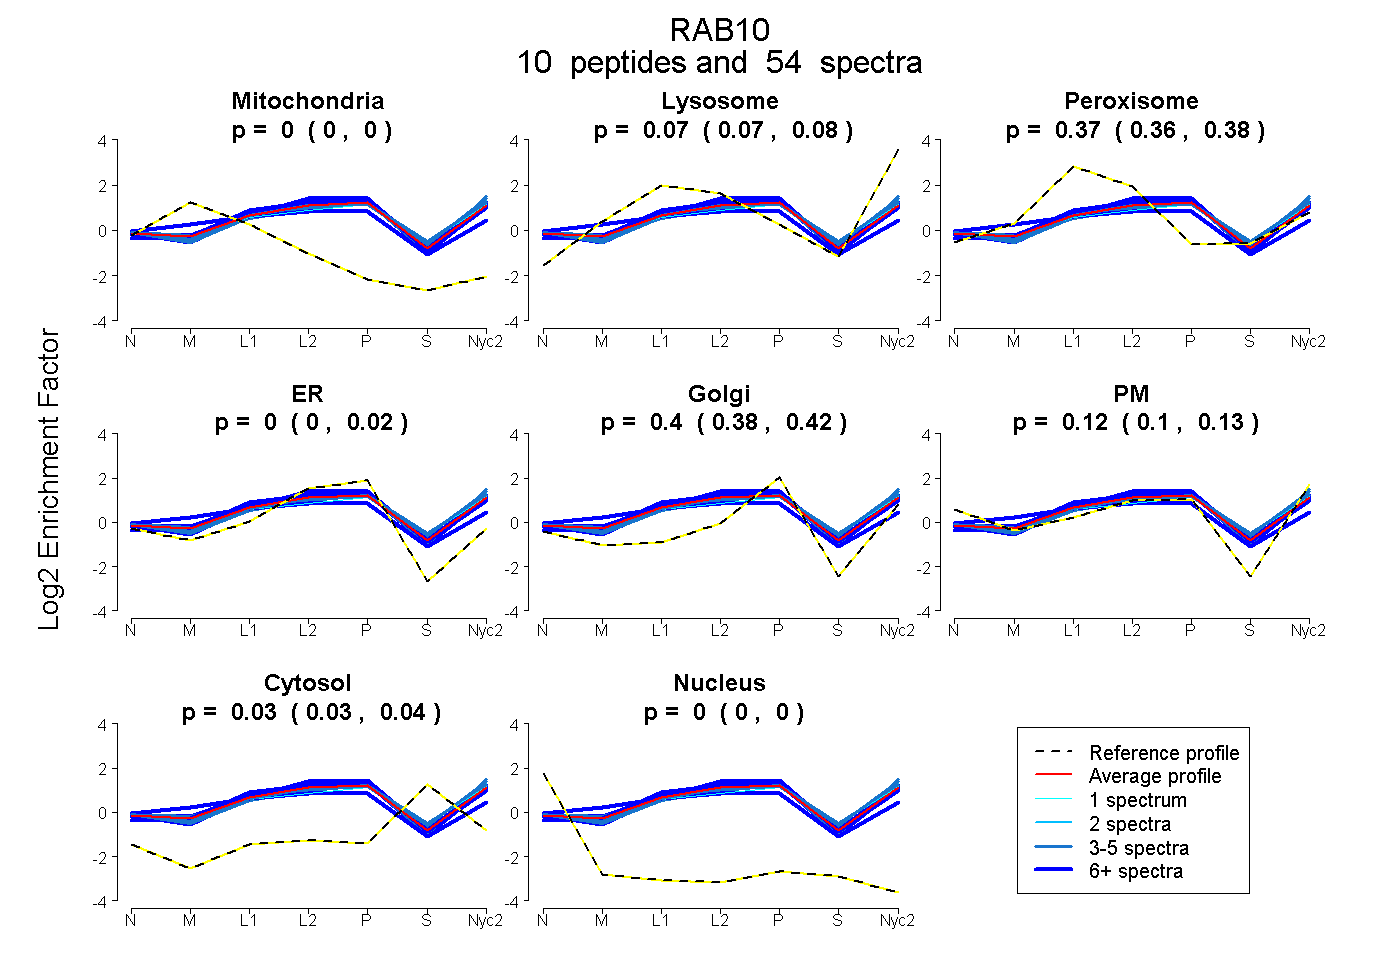
0.000 | 0.000
0.065 | 0.081
0.357 | 0.379
0.000 | 0.018
0.381 | 0.416
0.104 | 0.126
0.029 | 0.037
0.000 | 0.000
9peptides
spectra
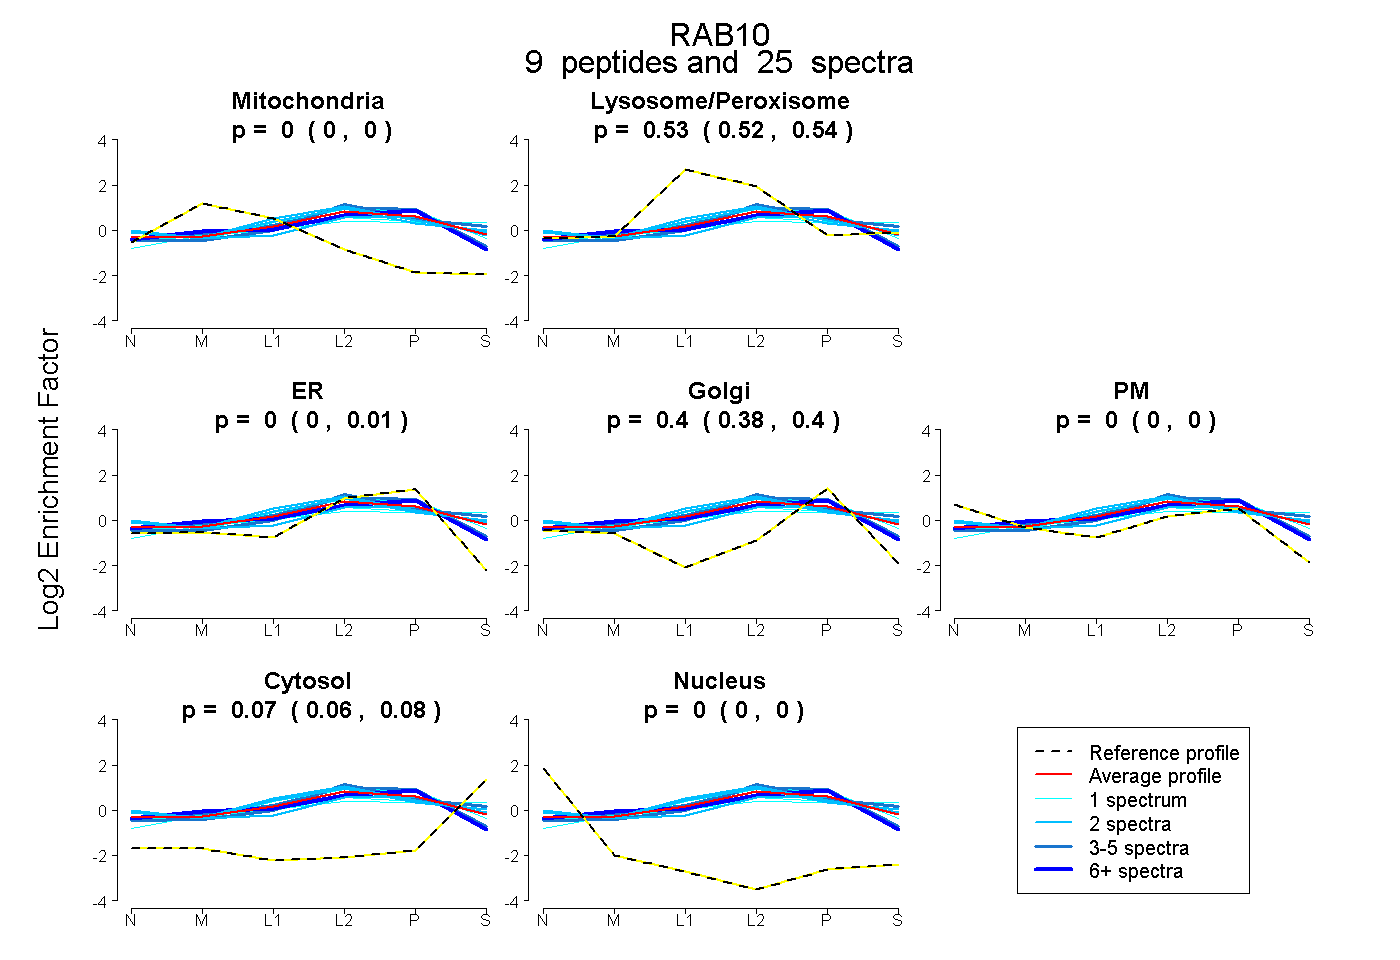
0.000 | 0.000
0.523 | 0.535
0.000 | 0.012
0.380 | 0.404
0.000 | 0.000
0.065 | 0.081
0.000 | 0.000
13peptides
spectra
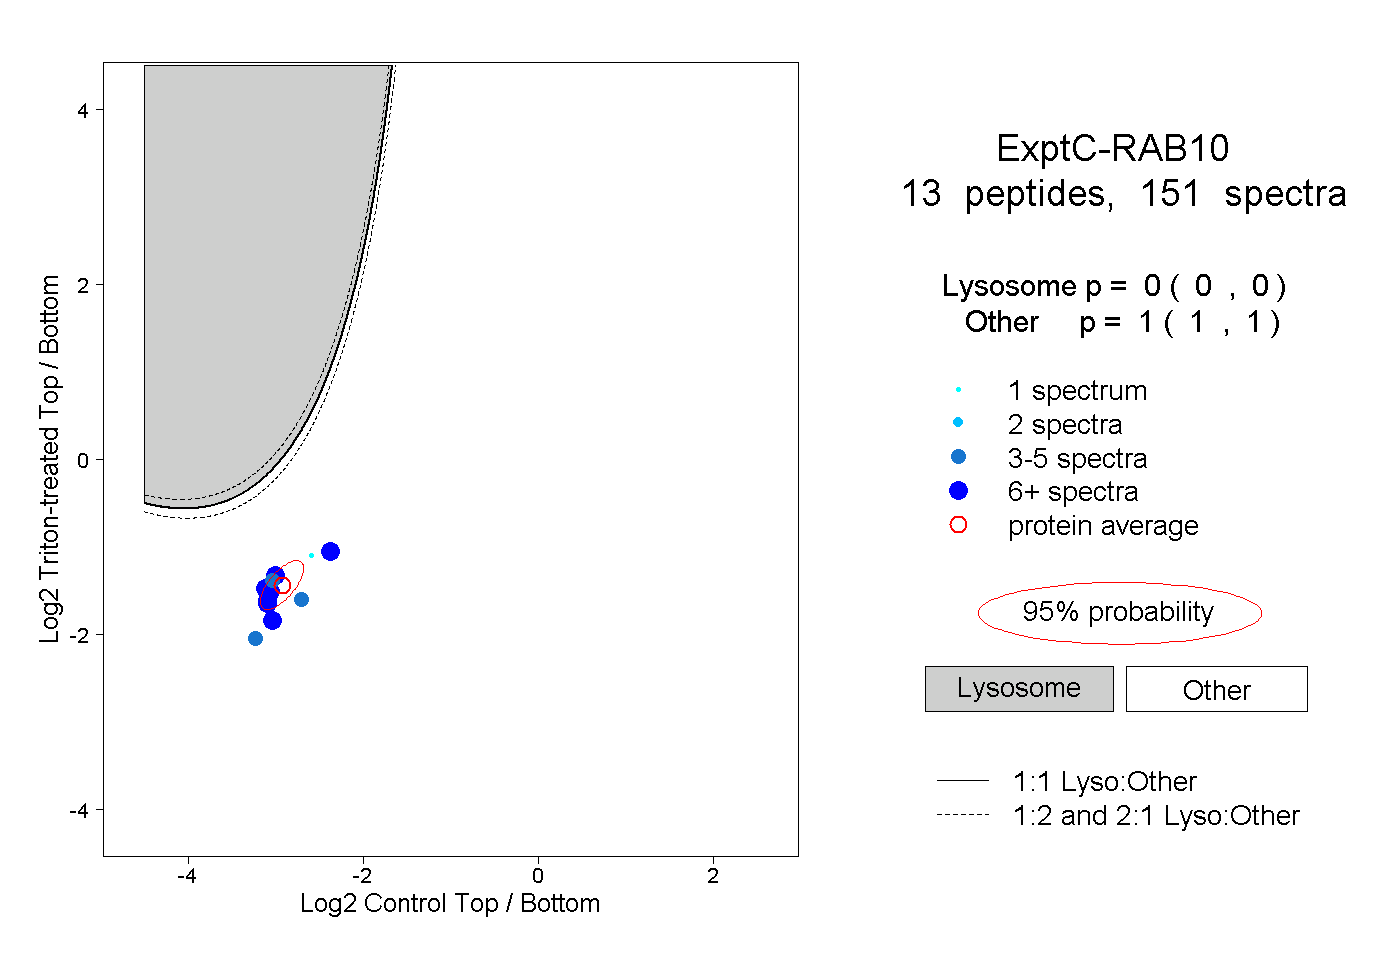
0.000 | 0.000
1.000 | 1.000
5peptides
spectra
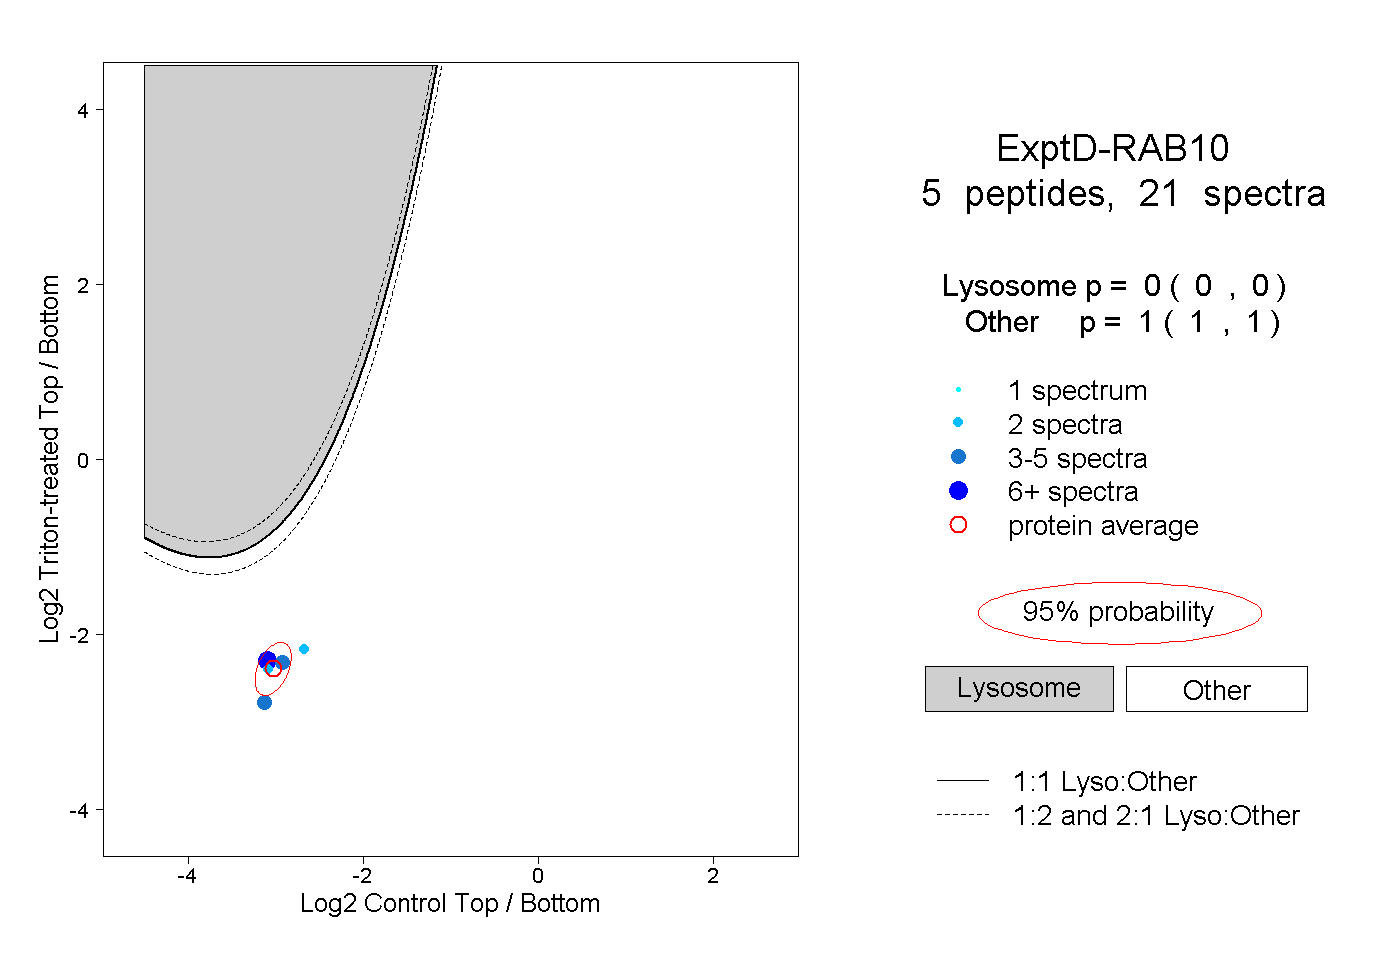
0.000 | 0.000
1.000 | 1.000